Since I started learning R, I wanted to play a bit with the use of R scripts in Power BI Desktop. Note that my R skills are very basic, so please don’t use this post as an example of top-notch R.
At this time, there are three places in Power BI Desktop where you can use your own (or blatantly stolen from the Internet) R scripts. R can be an excellent option for adding prediction to your data models. For each, I will demonstrate how to do it as well as show the overall conceptual data flow. For Report View, I will show two examples since there are two conceptual data flows that are supported when using an R script in Report View.
1. Query Editor – Source
2. Query Editor – Transformation
3. Report View – Using Power BI Desktop Data Model
4. Report View – Bypassing Power BI Desktop Data Model
There will be some overlap between my content here and the official Microsoft documentation via the sites below. My hope is that this post can augment the well-done docs that exist already by adding my own thoughts on this.
Run R Scripts in Power BI Desktop
Create Power BI Visuals Using R
You can also use R-based custom visuals in Power BI Desktop. However, you use those like any other visual rather than supplying your own R script. Since the focus here is on using your own R script, I decided not to discuss R-based custom visuals in this post.
Note on the Format of This Post
As you no doubt follow my blog with rapt joy, you will know that I usually walk through step-by-step instructions with numbered lines of text like the following:
1. Do this thing. It should look like Figure A.
Figure A
2. Now do this other thing. It should look like Figure B.
Figure B
For this post, I decided to start using the numbered stamps available in SnagIt (I LOVE THIS TOOL) so that the images themselves will walk through the steps as much possible. To that end, as you read this post, I would love to get your feedback on how this works for you, dear reader. If you feel strongly, or don’t, I would appreciate your thoughts in the comments section below. Thanks.
Prerequisites
All of the options I will show require you to have R installed on your machine. I am using R version 3.4.3 I got here as well as R Studio (an IDE: Integrated Scripting Environment) version 1.1.383 I obtained here. You can also use Microsoft R Open, which you can get here. All are free. I am choosing base R and R Studio because I want to play with/show the use of non-Microsoft tools in conjunction with Microsoft tools. I am using 2.53.4954.481 64-bit (December 2017) of Power BI Desktop. Note that things could look/behave differently in other version of Power BI Desktop.
For this post, I am using a well-known dataset known as the Iris dataset, which you can read about here. I downloaded the zip file from here to obtain a csv file of the data set for one of my examples. The Iris dataset is also included in the “datasets” package in R Studio, which I will use as well.
Note: A key R concept to understand is that of a data frame, which is essentially just data in a tabular format. In a data frame, the “columns” are actually called “variables.”
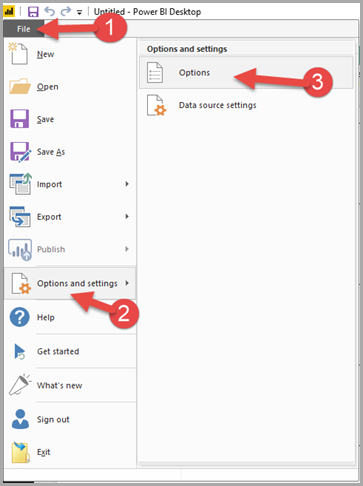
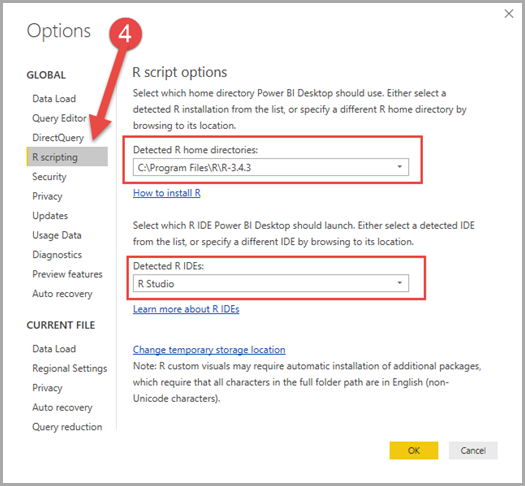
Once you have R and an R IDE installed, Power BI Desktop will detect them. You can see this in the Power BI Desktop Options. You can follow numbered steps in Figures 1 and 2 below.
Figure 1
Figure 2
If you have multiple versions of R or multiple R IDEs installed, you can choose which ones you want Power BI Desktop to use via the drop-down menus shown in the red rectangles in Figure 2 above. You can also use this window to reach further documentation and change what location R custom visuals use for temporary data storage.
Query Editor – Source
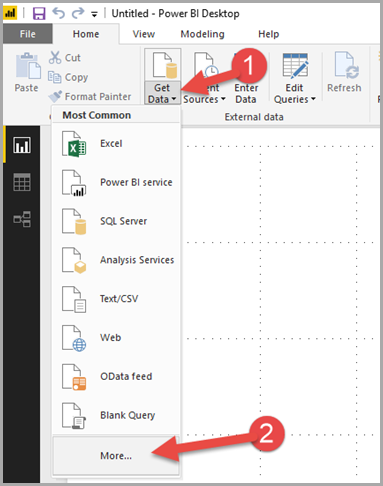
When you use R as a Source, both the Import of the data and (optionally) and Transformations on that data are performed by R. This can be a great option when you have R scripts that already prepare data the way you want and you want to mix that with other sources in Power BI Desktop. It can also be a great option when you have R scripts that access data sources not directly supported by Power BI Desktop. Or maybe you just prefer R to the Query Editor experience. Whatever your reason, here’s how to do it.
Figure 3
Figure 4
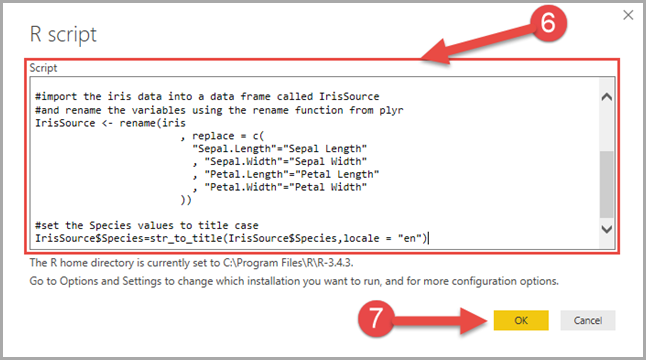
This opens the window in Figure 5. Paste the R script here, then click OK.
Figure 5
The full R script for this is the following:
#import the datasets package to get the iris data
library(datasets)

#import the plyr package to use rename
library(plyr)

#import the stringr package to use str_to_title
library(stringr)

#import the iris data into a data frame called IrisSource
#and rename the variables using the rename function from plyr
IrisSource <- rename(iris
                        , replace = c(
                          "Sepal.Length"="Sepal Length"
                          , "Sepal.Width"="Sepal Width"
                          , "Petal.Length"="Petal Length"
                          , "Petal.Width"="Petal Width"
                        ))

#set the Species values to title case
IrisSource$Species=str_to_title(IrisSource$Species,locale = "en")
This script imports the Iris dataset from the “datasets” package that comes with R Studio and uses functions from a few other packages to rename variables and change the case of the values in the Species variable. I chose to do this so that my R script actually performed some amount of transformation in addition to importing.
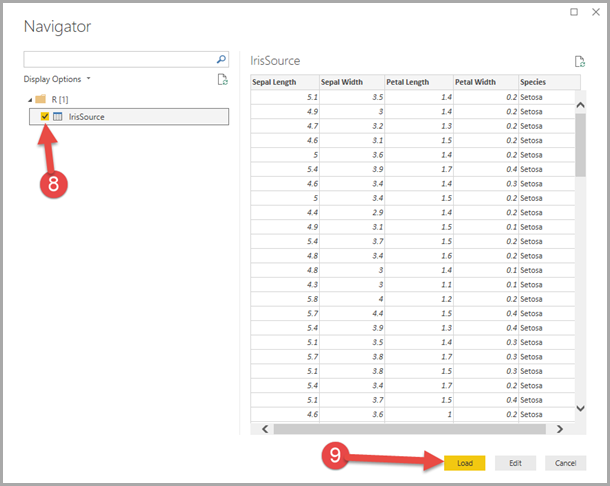
Figure 6 shows the preview of the IrisSource table. To use it, you can click the checkbox to select it and click Load.
Figure 6
Figure 7
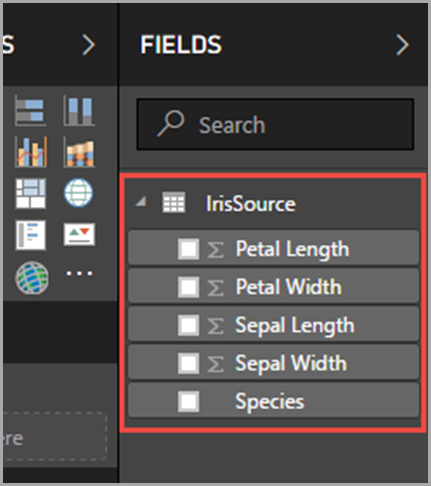
Once it loads, you should see the IrisSource table in the FIELDS pane in Power BI Desktop. Now you can use it like any other table (create DAX Measures, relate it to other tables, or even perform additional transformations in Query Editor if you wish). In this particular example, I did everything in the R Script to show that you can.
Query Editor – Transform
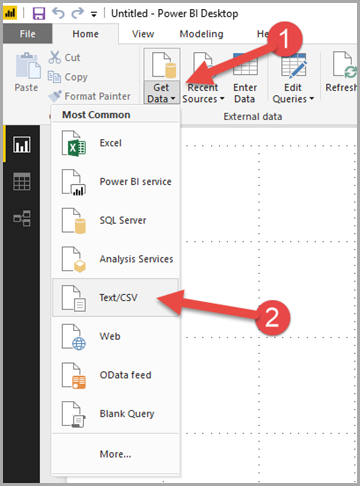
You also have the ability to use an R script to transform data you already imported into Power BI Desktop. This can be a great option when you already have data in your model and you want to shape it with R. In this example, we’ll import the Iris dataset from a csv file using the native source in the Query Editor. Then, we’ll use an R script to Transform it. Follow these steps to get this done.
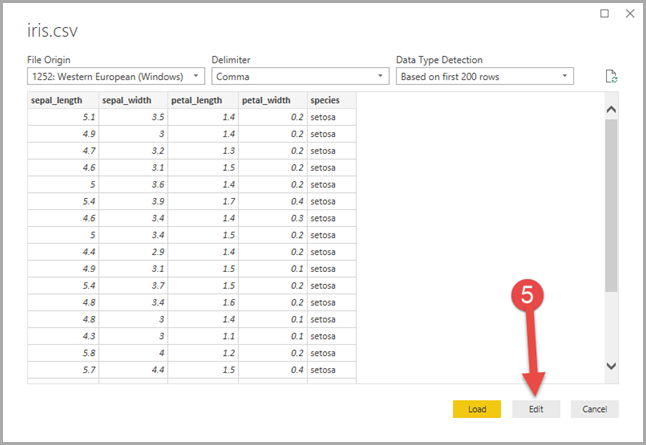
Figure 8
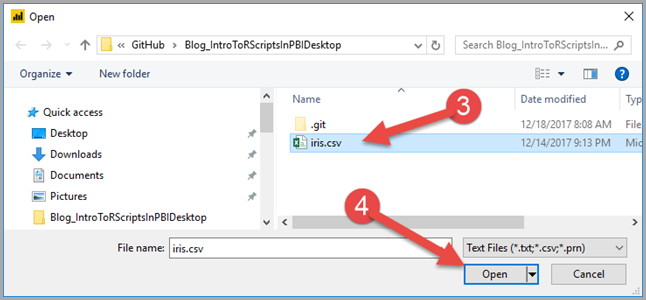
Browse to the file you want to import.
Figure 9
Figure 10
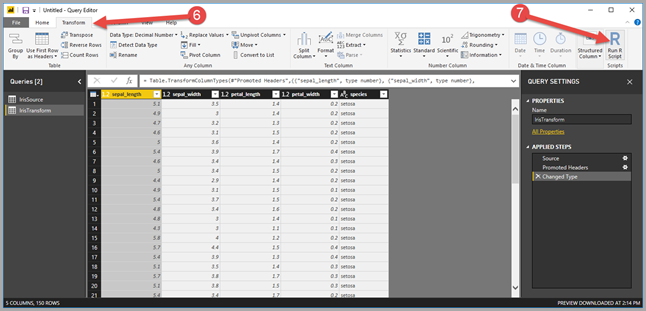
Once you have imported the file, and are in the Query Editor, your screen should resemble Figure 11.
Figure 11
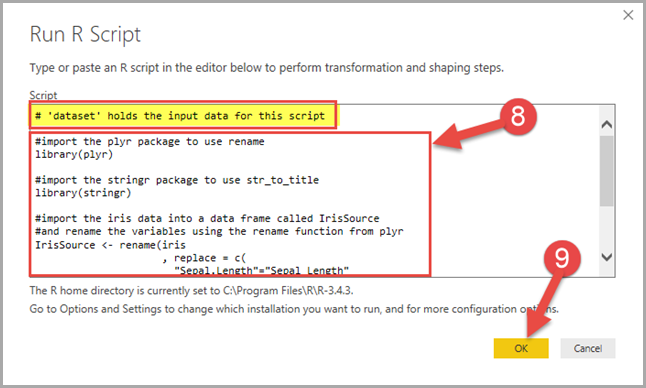
Figure 12
Note the highlighted line at the top of the Script box in Figure 12. This is an indication that the data in the table has already been imported into a data frame called “dataset” for use in your R script. So, you need to reference “dataset” in your script to work with the data. The full script for this example is below. It performs the exact same transformations as in the example above, this time naming the resulting table IrisTransform instead of IrisSource.
#import the plyr package to use rename
library(plyr)

#import the stringr package to use str_to_title
library(stringr)

#import the iris data into a data frame called IrisSource
#and rename the variables using the rename function from plyr
IrisTransform <- rename(iris
                     , replace = c(
                       "Sepal.Length"="Sepal Length"
                       , "Sepal.Width"="Sepal Width"
                       , "Petal.Length"="Petal Length"
                       , "Petal.Width"="Petal Width"
                     ))

#set the Species values to title case
IrisTransform$Species=str_to_title(IrisTransform$Species,locale = "en")
Figure 13
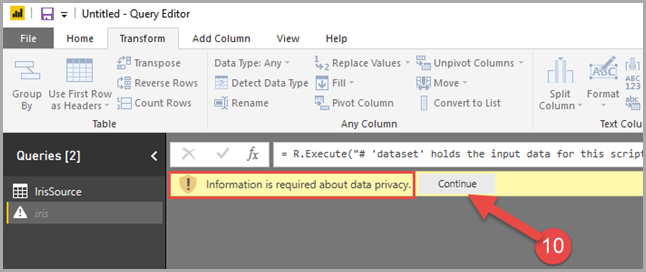
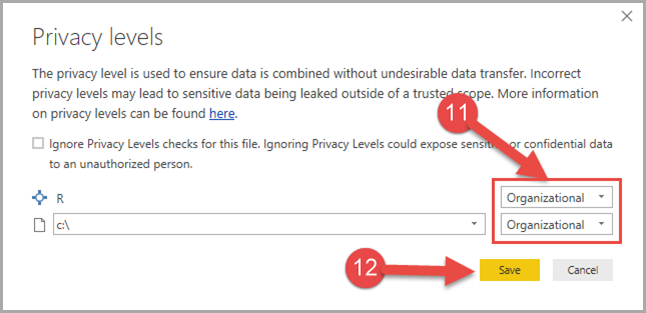
In the interest of data privacy, it is necessary to tell Power BI Desktop what level of privacy is required for each source in the file here.
Figure 14
This is where you indicate how private each data source should be considered. You can read more about privacy levels here. This is particularly important in cases where you could be mixing, for example, data from a sensitive database with reference data from a public source. Since, in some situations, the Query Editor will include data from one source when filtering another, this could mean that data from a public source gets sent as part of a query to that sensitive database. This could compromise the security of the private database. Note that you can also choose to ignore Privacy Levels for this file. If you are using data sources that you know and trust, you can disable the check in order to increase query performance. Please be careful when choosing this option so that you don’t inadvertently throw away privacy checks that really should be in place. Here, I will just set both sources as Organizational.
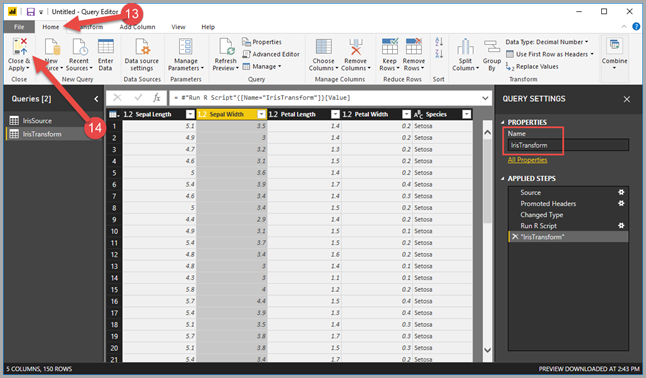
Figure 15
Note that in the Properties pane at the right, I changed the name of the final Query to be IrisTransform. Once you Close and Apply, you should see that IrisTransform has been added to the data model.
Figure 16
Once again, this new table can be treated like any other table in your model.
Report View – Using Power BI Desktop Data Model
In Power BI Desktop, you have the ability to create R visuals on data already imported into the model. In this example, we will use an R script to create an R visual on the data in the IrisTransformation table we created in the previous example. Here’s how.
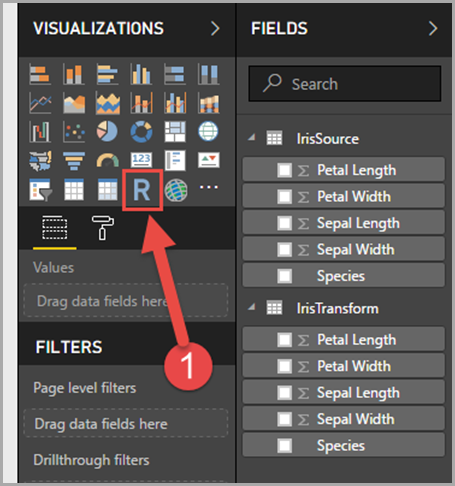
Figure 17
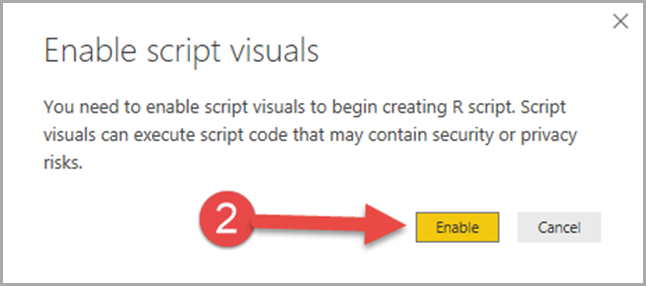
In order to use script visuals in your file, you must Enable that feature.
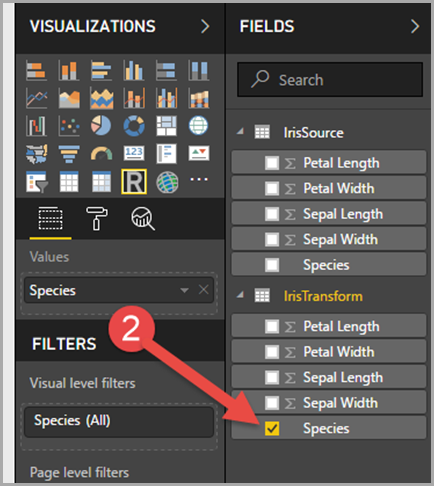
Figure 18
Figure 19
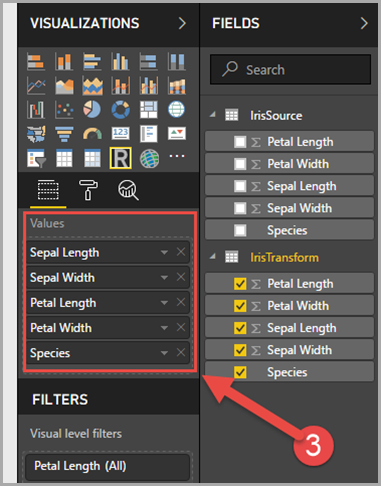
In the context of the R visual, we need to add the fields we want to use in the visual to the Values field. It is important for this example that you select the fields in the order they are listed in Figure 19. This is because the R script I got from the matplot documentation uses positional references instead of actual variable names when referencing the variables. Since Sepal Length is the first variable in the Iris data frame, that column must be selected first. This matters here because Power BI Desktop automatically lists fields alphabetically in the FIELDS pane. Rather than “fix” it myself and make the script use names instead of variable ordinal position, I decided to leave it alone to show that this is something you may have to deal with. Personally, I would avoid using ordinals as issues like the above can crop up. TSQL, likewise, supports using column ordinals in, for example, the ORDER BY clause. I never use that. Despite the extra coding involved, in the interest of clarity, I always use column name references.
Note that you MUST select at least one field from the FIELDS pane before Power BI Desktop allows you to paste in your R script.
Figure 20
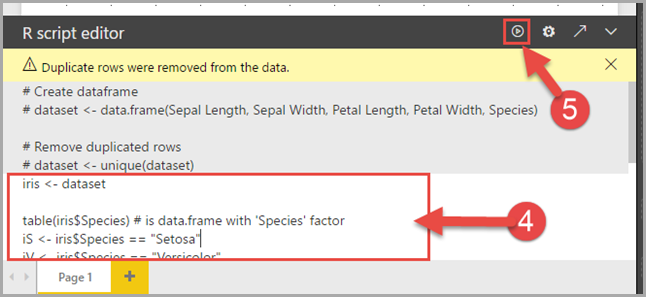
The fields from the table you add to the Visual go into the data frame called “dataset” and become available to the R script. Once you have pasted your script, you can click the Run Script button (step 5 above) to execute it. The full R script for this example is as follows.
iris <- dataset

table(iris$Species) # is data.frame with 'Species' factor
iS <- iris$Species == "Setosa"
iV <- iris$Species == "Versicolor"
op <- par(bg = "bisque")
matplot(c(1, 8), c(0, 4.5), type =  "n", xlab = "Length", ylab = "Width",
        main = "Petal and Sepal Dimensions in Iris Blossoms")
matpoints(iris[iS,c(1,3)], iris[iS,c(2,4)], pch = "sS", col = c(2,4))
matpoints(iris[iV,c(1,3)], iris[iV,c(2,4)], pch = "vV", col = c(2,4))
legend(1, 4, c("    Setosa Petals", "    Setosa Sepals",
               "Versicolor Petals", "Versicolor Sepals"),
       pch = "sSvV", col = rep(c(2,4), 2))
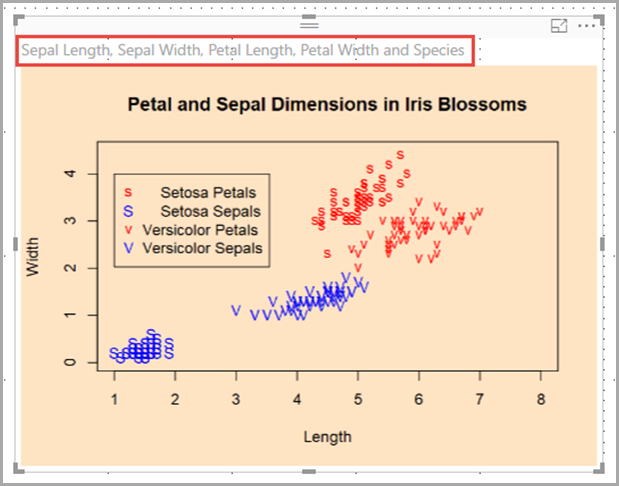
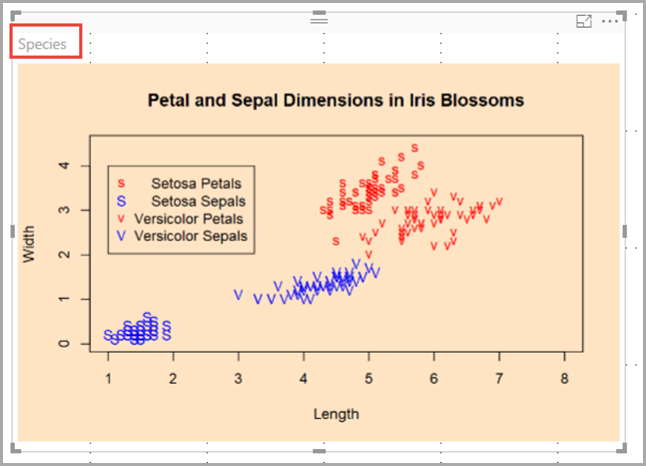
The script above is a slightly modified version of an example from the documentation for matplot here. My modification was to import the “dataset” data frame into one called “iris” that is used throughout the script. That meant I didn’t have to change all the references in the script I got from the matplot documentation example. I should note that I do not fully understand how the script works yet. I chose it because it produces a very interesting visual that is very clearly NOT one natively produced by Power BI. The final visual is shown in Figure 21.
Figure 21
Note that Power BI Desktop lists the columns involved in the visual in the title bar, just as it does with native visuals. In this case, it lists out all of the columns from the IrisTransform table in the order I selected them.
Report View – Bypassing Power BI Desktop Data Model
With this method, the script use for the R visual references data outside of the Power BI Desktop data model.
Figure 22
Figure 23
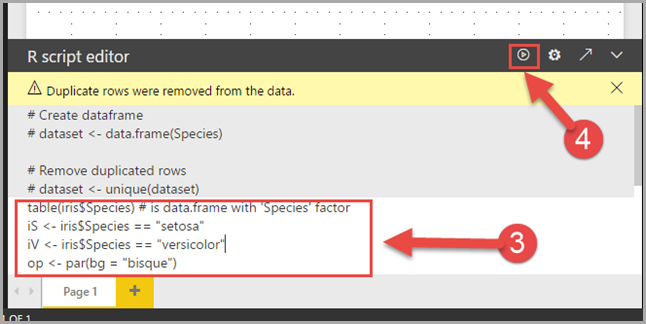
We select one field in order to activate the R script pane in the R visual.
Figure 24
The full script is as follows.
table(iris$Species) # is data.frame with 'Species' factor
iS <- iris$Species == "Setosa"
iV <- iris$Species == "Versicolor"
op <- par(bg = "bisque")
matplot(c(1, 8), c(0, 4.5), type =  "n", xlab = "Length", ylab = "Width",
        main = "Petal and Sepal Dimensions in Iris Blossoms")
matpoints(iris[iS,c(1,3)], iris[iS,c(2,4)], pch = "sS", col = c(2,4))
matpoints(iris[iV,c(1,3)], iris[iV,c(2,4)], pch = "vV", col = c(2,4))
legend(1, 4, c("    Setosa Petals", "    Setosa Sepals",
               "Versicolor Petals", "Versicolor Sepals"),
       pch = "sSvV", col = rep(c(2,4), 2))
In this case, I completely ignore the “dataset” data frame provided by Power BI Desktop. Instead, I reference the iris dataset that R Studio already knows about.
Figure 25
As evidence I am not cheating, notice that my “dataset” data frame only includes the Species field from my data model. Yet the visual still properly plots the length and width just like my previous example. Also notice the title bar of the visual indicates the one field from IrisTransform I selected, but did not use.
There is one important thing to note when choosing whether to bother importing data into the Power BI Desktop data or just have the R visual take care of it. Visuals that do not reference data in the model will not participate in cross filtering and slicers. So, if we put the visuals from the two examples side by side and add a slicer, you will notices that the visual based on the IrisTransform table in the data model is filtered by the slicer, but the visual from our final example, bypassing the data model, is not.
Figure 26
Notice when Setosa is selected in the Species slicer, the Versicolor data points disappear in the left visual (using IrisTransform), but not the right(bypassing the Power BI Desktop data model).
Wrapping Up
Power BI Desktop is already a super flexible tool with the native functionality. The ability to extend that with R scripts just adds another layer of awesome. Hopefully, I showed that it is not very hard to use R scripts in Power BI Desktop. As I continue learning R, I hope to produce more posts that look even deeper at this great functionality.
