Category: SSAS

Processing Azure Analysis Services Using Azure Automation

Recently, I was working with a customer who was deploying a Tabular model to Azure Analysis Services. They were wondering how they would automate the processing of that model. There are certainly a few ways to do that. You can do it with C# or JavaScript via Azure Functions, as is described in this post by Orsolya Gal. Since my background is not in C#, and the customer didn’t have that either, I decided to keep that option on a shelf for later.
 
I have done some PowerShell and I have worked with Azure Automation, so that seemed like a better place to start for me. Two posts in particular were helpful here:
 
Schedule Process Azure Analysis Services Database by the folks at microsoft-bitools.blogspot.com
 
Automation of Azure Analysis Services with Service Principals and PowerShell by Christian Wade, Senior Program Manager on the Analysis Services product team
 
My own solution ended up combining features from both of the above walk-throughs. My goal with this post is not only to walk through my own solution, but to also share, at each stage, why I made the choices I made. Note that I am still very much a student of PowerShell, so experts in that area will likely know of better ways to accomplish what I did. If you are a PowerShell guru and see where my scripts could be improved upon, I would love for you to share that in comments so I (and anyone else reading this) can learn. Mmmmm… learning…
 
Note: If you put all of this PowerShell into a single script file, you can declare each variable a single time and use it as many times as you need. For example, you will be entering a Password and storing it in a secure credential. You will need that in more than one place for this solution. If you have separate scripts for each location, you will have to enter that password more than once and increase the chance of having them not match, which will cause errors. I will proceed as though we are putting all of the PowerShell in a single script file to avoid having to repeat declarations and value assignments for PowerShell variables involved.
 

Creating Azure Active Directory Service Principal Using PowerShell

As Christian points out in his post above, Service Principals are essentially the Azure implementation of the Service Accounts we have on-premises. They allow applications and services to authenticate and access resources without manual intervention. While you can create service principals in the Azure Portal, I chose to go with PowerShell so that I could save the script and easily copy it for use again and again. In order for this to work, it is necessary to install the Azure PowerShell modules on the machine from which you want to run the scripts. In my case, it is my Surface Book. I, personally, use the Windows PowerShell ISE (Integrate Scripting Environment) that is native to Windows 10. Once you have that open, you can use the Login-AzureRmAccount cmdlet to log into Azure so you interact with the objects, etc, in the Azure subscriptions you have access to.
 
Once you log in, the output will include your Tenant ID. Capture that value for later.
 
image
 
From here, we will just assume you have done that.
 
$subscriptionID = "<your subscription ID GUID>"

$rootNameValue = "mvazureasdemo"

$servicePrincipalName = "$($rootNameValue)serviceprincipal"
$servicePrincipalPassword = Read-Host `
-Prompt "Enter Password to use for Service Principal" `
-AsSecureString

Write-Output "Selecting Azure Subscription..."
Select-AzureRmSubscription -Subscriptionid $subscriptionID

I started by creating a few variables and assigning them values. I will end up specifically selecting which azure subscription I want to work in. By specifying this, I can make sure I am creating and working with objects in the right place. To find your subscription ID, you can follow these steps in the Azure Portal.
 
I use the $rootNameValue as a prefix for all objects created as part of a solution. So, my server names, Azure Automation Assets (we’ll get to these in a bit), etc, all will start with this value. It helps me keep clear what goes with what. The $servicePrincipalName then derives its value by appended “serviceprincipal” onto the root name value.
 
The expression for the $servicePrincipalPassword will generate a box for me to securely enter in the password I want my Service Principal to have. This method allows me to make sure I don’t have something as sensitive as a password sitting in my code anywhere.
 
That last line above selects the subscription whose ID I put in the $subscriptionID variable.
 
# Get the list of service principals that have the value in 
# $servicePrincipalName as part of their names
$sp=Get-AzureRmADServicePrincipal `
-SearchString $servicePrincipalName

# Filter the list of just the ONE service principal with a DisplayName
# exactly matching $servicePrincipalName
$mysp = $sp | Where{$_.DisplayName -eq $servicePrincipalName}

# Isolate the ApplicationID of that service principal
$appSPN = $mysp.ApplicationId

This next section checks to see if a Service Principal already exists with the name I want to use. It is a little bit involved since I need to filter on a search string and not a specific name (the Get-AzureRmADServicePrincipal does not currently support filtering by DisplayName directly). So, I isolate all existing (if any) service principals that have my $servicePrincipalName value IN their names. For example, searching for “Foo” would return both “Fool” and “Foot.” Then I filter that list for the one that has a DisplayName property that matches my $servicePrincipalName value exactly. I then grab the ApplicationID property of THAT principal for use later.
 
# Create a service principal if it does not exist
Write-Output "Creating Service Principal $servicePrincipalName..."

try
{
If(!($appSPN))
{
New-AzureRmADServicePrincipal `
-DisplayName $servicePrincipalName `
-Password $servicePrincipalPassword

# Sleep for 20 seconds to make sure principal is propagated in Azure AD

Sleep 20

}
Else
{
Write-Output "Service Principal $servicePrincipalName already exists."
}
}
catch
{
Write-Error -Message $_.Exception
throw $_.Exception
}

In the code section above, I first check to see if my $appSPN variable has a value. If the Service Principal I want to create already exists, then its ApplicationID property value will be in that variable. If that variable is empty, I go ahead and create Service Principal using the value in my $servicePrincipalName variable for the DisplayName and the password in my $servicePrincipalPassword variable for the password. Service Principals can be created with certificates as well. I chose to use the password for now for simplicity. If the Service Principal already exists, I skip the creation and just return a message indicate it already exists. This means I can run my script multiple times without causing issues or generating errors from trying to create a object that already exists.
 
If the creation step DOES execute, my script waits 20 seconds to make sure that new Service Principal is alive and well in Azure Active Directory before taking my next action below.
 
# Assigning Service Principal $servicePrincipalName to Contributor role
Write-Output "Assigning Service Principal $servicePrincipalName to Contributor role..."

try
{
If(!(Get-AzureRmRoleAssignment `
-RoleDefinitionName Contributor `
-ServicePrincipalName $appSPN `
-ErrorAction SilentlyContinue))
{
New-AzureRmRoleAssignment `
-RoleDefinitionName Contributor `
-ServicePrincipalName $appSPN
}
Else
{
Write-Output "Service Principal $servicePrincipalName already `
assigned to Contributor role."

}
}
catch
{
Write-Error -Message $_.Exception
throw $_.Exception
}

 
In the section of code above, I check to see if my Service Principal has already been assigned to the Contributor role in my Azure Subscription. If so, I just return a message to that effect. If not, I add it. Notice again that this prevents my script from trying create something that already exists.
 
Once creation of the Service Principal completes, the output will provide you with the Application ID GUID value. Take note of that as we will need it shortly.
 
image
 

Assign Service Principal to Administrator Role on Azure Analysis Services Server

The newly created service principal needs to be added to the Administrators role on the server via the Security tab in Server Properties. This is to provide it with the necessary rights to perform Processing operations. To add the principal, use the account picker or do what I did, create the string in a text editor and paste it in:
 
app:<Application ID>@<Azure tenant ID>

image
 

Azure Automation Modules

If you don’t already have an Azure Automation account, you can follow the steps here to create one. PowerShell cmdlets are grouped together in Modules that share certain context. For example, Modules that are intended for management of SQL Servers are grouped together in the SqlServer module. Whether it be on your computer for use in the PowerShell ISE or in Azure Automation, the use of cmdlets is only possible when the Modules that contain those cmdlets are installed. You can read more about installing Modules here. For the purposes of processing Azure Analysis Services models with Azure Automation, it will be necessary to install the Azure.AnalysisServices and SqlServer modules in your Automation account. Note that each of those pages includes a Deploy to Azure Automation button.

Azure Automation Basics

Azure Automation allows you to execute scripts against your Azure environment. The components that perform the work, that contain the scripts, are called Runbooks. There are a few different scripting languages supported (including Python, which is now in Preview). For this process, we will use PowerShell Runbooks.

Often, Runbooks will have various parameters or values that are needed at runtime. For example, if you have a Runbook that boots up a virtual machine, you will need to tell it WHICH virtual machine to start, etc. These values can be passed into the Runbooks at runtime as Parameters, OR you can store these values in Assets like Variables and Credentials. For this process, we will be using one Variable Asset and one Credential Asset. Assets allow you to store values once but make those values available across all of your Runbooks, etc. Super cool.

Azure Automation Variable Asset

One value we will need to pass to our Runbook for processing out Analysis Services model is the Tenant ID of our Azure Subscription. This is a GUID that you are welcome to type/paste in every time you want to use it. Or you can hard-code it into your Runbooks that need it. But there is a far better way. You can store it in a Variable Asset. The instructions there show you how to create the variable via the Azure Portal. Since we are already doing PowerShell, let’s stick with it.

# Create function to create variable assets
function CreateVariableAsset
{

param
(
[string] $variableName
, [string] $variableValue
)

Write-Host "Creating Variable Asset $variableName..."

try{
If(!(Get-AzureRmAutomationVariable `
-AutomationAccountName $automationAccountName `
-ResourceGroupName $automationResourceGroup `
-Name $variableName `
-ErrorAction SilentlyContinue))
{
New-AzureRmAutomationVariable `
-AutomationAccountName $automationAccountName `
-ResourceGroupName $automationResourceGroup `
-Name $variableName `
-Value $variableValue `
-Encrypted $false `
-ErrorAction Stop

Write-Host "$variableName created successfully. `r`n"

}
Else
{
Write-Host "Variable Asset $variableName already exists. `r`n"
}
}
catch
{
Write-Error -Message $_.Exception
throw $_.Exception
}

}

The PowerShell above creates a Function that includes the necessary script to create an Azure Automation Variable Asset. Creating functions can be super helpful when you need to run the same block of code several times, with only minor changes to parameter values, etc. I created this function when building out a solution that involve a couple dozen Variables. Rather than repeat this block of code a couple dozen times, I created it once and then called it for each Variable I needed to create. This makes for much cleaner and easier to manage code.

$automationAccountName = "AutomationB"
$automationResourceGroup = "AutomationBRG"
$variableTenantIDName = "$($rootNameValue)tenantid"
$varaibleTenantIDValue = "<your Tenant ID GUID>"

First, we need a create a few more PowerShell variables. The first two specify the name and resource group of the Azure Automation account we are using. When creating Azure Automation components via PowerShell, you must specify which Automation account will house the objects, as you can have more than one Automation account.

The next two variables provide the Name and Value of our Variable Asset, respectively.

CreateVariableAsset `
-variableName $variableTenantIDName `
-variableValue $variableTenantIDValue

The block above calls our function to create the Variable Asset, if it does not already exist.

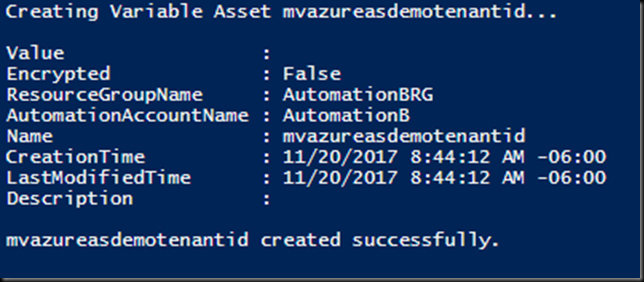
image

Hazzah!

Azure Automation Credential Asset

Since are going to automate use of a Service Principal with a password, we want to store that securely so that our Runbook can get to it without additional intervention. To do that, we use a Credential Asset. That link provides instructions on creating a Credential Asset via the Azure Portal.

# Create function to create credential assets
function CreateCredentialAsset
{

param
(
[string] $credentialName
, [PSCredential] $credentialValue
)

Write-Host "Creating Credential Asset $credentialName..."

try{
If(!(Get-AzureRmAutomationCredential `
-AutomationAccountName $automationAccountName `
-ResourceGroupName $automationResourceGroup `
-Name $credentialName `
-ErrorAction SilentlyContinue))
{
New-AzureRmAutomationCredential `
-AutomationAccountName $automationAccountName `
-ResourceGroupName $automationResourceGroup `
-Name $credentialName `
-Value $credentialValue `
-ErrorAction Stop

Write-Host "$credentialName created successfully. `r`n"

}
Else
{
Write-Host "Credential Asset $credentialName already exists. `r`n"
}
}
catch
{
Write-Error -Message $_.Exception
throw $_.Exception
}

}

I once again create a Function for the Asset creation.

$credentialServicePrincipalName = "$($rootNameValue)serviceprincipal"
$credentialServicePrincipalUserNameValue = "<your Application ID GUID>"

We need to create two more PowerShell variables; one for the Credential Asset name, another for the Credential Asset User Name value. We will need a Password but we already have that variable from when we created the Service Principal above. We can reuse that same variable so we don’t have to enter in a password again.

# Create a PSCredential object using the User Name and Password
$credentialServicePrincipalValue = `
New-Object System.Management.Automation.PSCredential`
(
$credentialServicePrincipalUserNameValue `
, $servicePrincipalPassword
)


# Call function to create credential assets
CreateCredentialAsset `
-credentialName $credentialServicePrincipalName `
-credentialValue $credentialServicePrincipalValue

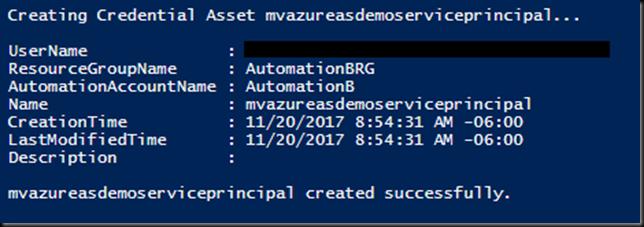
We have to do one extra step here. We start by taking our User Name (Application ID) and Password and using them to create a PSCredential object. Then we call our function to create our Credential Asset.

image

More Hazzah!

Azure Automation Runbook

As I stated before, Runbooks contain the scripts that perform the work in Azure Automation. You can see how to create a Runbook in the Azure Portal. We will create out Runbook with PowerShell. However, we will not be using PowerShell to actually put the script inside the Runbook. You can do that with PowerShell by importing a saved .ps1 (in the case of a PowerShell runbook) that contains the PowerShell the Runbook will contain. I decided that was more complex than I wanted to get here. Besides, the steps after that take place in the Portal anyway. So, we will create the Runbook using PowerShell and then go to the Azure Portal to edit it and paste in our script.

$runbookName = "$($rootNameValue)processasdatabase"

We start by declaring a PowerShell variable to hold the name for our Runbook.

# Create empty Runbook
Write-Host "Creating Runbook $runbookName..."

try{
If(!(Get-AzureRmAutomationRunbook `
-AutomationAccountName $automationAccountName `
-ResourceGroupName $automationResourceGroup `
-Name $runbookName `
-ErrorAction SilentlyContinue))
{
New-AzureRmAutomationRunbook `
-AutomationAccountName $automationAccountName `
-ResourceGroupName $automationResourceGroup `
-Name $runbookName `
-Type PowerShell `
-ErrorAction Stop

Write-Host "Runbook $runbookName imported successfully. `r`n"

}
Else
{
Write-Host "Runbook $runbookName already exists. `r`n"
}
}
catch
{
Write-Error -Message $_.Exception
throw $_.Exception
}

Here we create the Runbook, using our shiny new $runbookName PowerShell variable along with a couple we declared previously.

image

Hazzah!

When to go to the Runbooks blade of our Automation account in the Azure Portal, we see our shiny new Runbook. It still has that new Runbook smell.

image

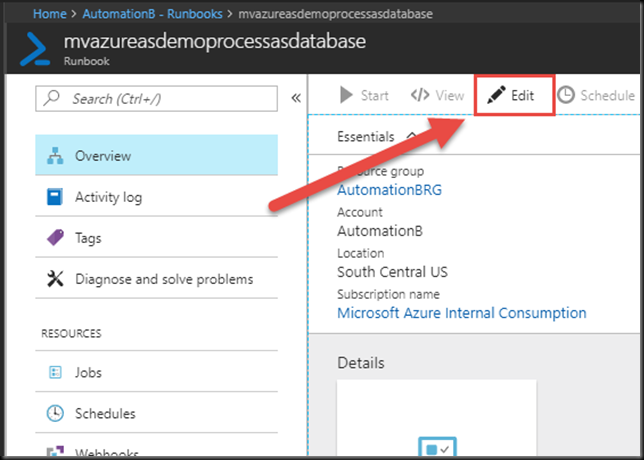
Clicking on the name of the Runbook will open the Runbook blade. Here we click the Edit button.

image

Then we past our PowerShell script into the window.

# Get the values stored in the Assets
$TenantId = Get-AutomationVariable -Name "mvazureasdemotenantid"
$Credential = Get-AutomationPSCredential -Name "mvazureasdemoserviceprincipal"

# Log in to Azure Analysis Services using the Azure AD Service Principal
Add-AzureAnalysisServicesAccount `
-Credential $Credential `
-ServicePrincipal `
-TenantId $TenantId `
-RolloutEnvironment "southcentralus.asazure.windows.net"

# Perform a Process Full on the Azure Analysis Services database
Invoke-ProcessASDatabase `
-Server "asazure://southcentralus.asazure.windows.net/mvazureasdemoserver" `
-DatabaseName "AzureASDemo" `
-RefreshType "Full"

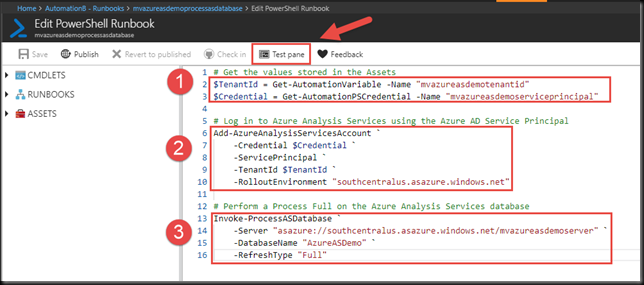
Once we do, it should look like the figure below.

image

There are a few things to note here.

1. The names in the top section of the runbook must match the names you used when creating the Assets.

2. I am using the Add-AzureAnalysisServicesAccount cmdlet instead of the Login-AzureAsAccount cmdlet Christian used. I had trouble making that one work and more trouble trying to find documentation on it. So, I punted and used a different one. You can find documentation on the Add-AzureAnalysisServicesAccount cmdlet here. This is used to pass our Service Principal into the Azure Analysis Services server to connect to it.

3. Notice that my Azure Analysis Services server name matches my naming convention for this entire solution. Yeah. I know. I’m pretty cool. Yours does not have to match. Mine only does since I created it solely for this demo/post. This step performs the processing operation on the database. In this example, I am performing a Process Full on the entire database. You have many other options as well. You can find more information on the Invoke-ProcessASDatabase cmdlet here. On that page, the left sidebar includes other cmdlets related to processing Analysis Services objects.

When you have finished reveling in the awesomeness of this Runbook, click on the Test Pane button, shown by the arrow in the image above.

image

If our Runbook had actual parameters, they would show up in the Parameters section and we would be able to enter values for them. Since our Runbook is configured to just go grab what it needs from Assets, all we have to do is click Start.

image

Our Test run will go into queue to await its turn to run. Since we do not each have our own dedicated capacity in Azure Automation, each job needs to wait for a worker to pick it up to execute it. I have not seen the wait exceed ten seconds, personally. But not that starting a Runbook is not an instantaneous process. You can read more about Runbook execution in Azure Automation here.

image

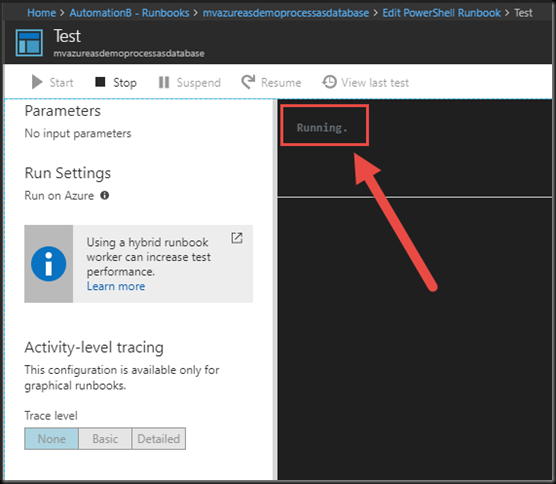
Once a worker has picked it up, the status will change to Running.

image

Victory! Note that although this was a Test Run in the context of Azure Automation, this ACTUALLY PEROFMS THE ACTIONS in the Runbook. It does not “pretend” to call the Runbook. It executes it. In full.

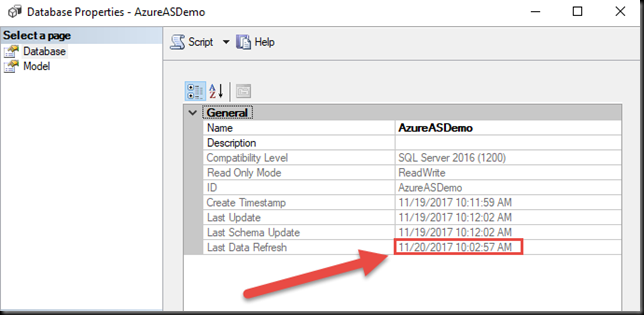
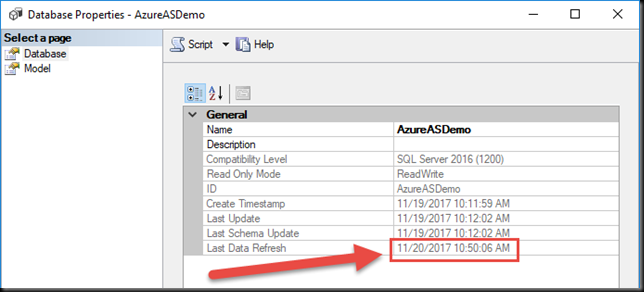
You can check the status of the database via its Properties in SQL Server Management Studio.

image

The Last Data Refresh status should closely match the time you ran the Test Run.

Close the Test Pane via the X in the upper right-hand corner to return to the Edit pane.

image

Click Publish. This will fully operationalize your Runbook, replacing the version of the Runbook that exists if it was published previously. Once it is published, we can start it manually or give it a Schedule.

image

Note: If you just want to look at the contents of the Runbook, use the View button. Entering Edit mode on a Published Runbook will change its status to In Edit, and it will not execute. If you do enter Edit mode by accident, and don’t want to change anything, choose the Revert to Published button to exit Edit mode and return the Runbook to the Published state.

Click the Schedule button.

image

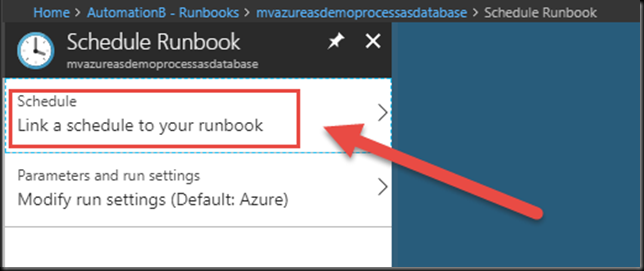
You can modify Parameter settings, etc, from the bottom option. In our case here, our Runbook has no parameters, so we can click to Link a schedule to our Runbook.

image

This will launch the Schedule blade. If you already have existing Schedules in your Automation Account, like “Every Monday at 6 AM” or something, those will show up here and you can choose to tack your Runbook execution onto one of those. I will just create a new one.

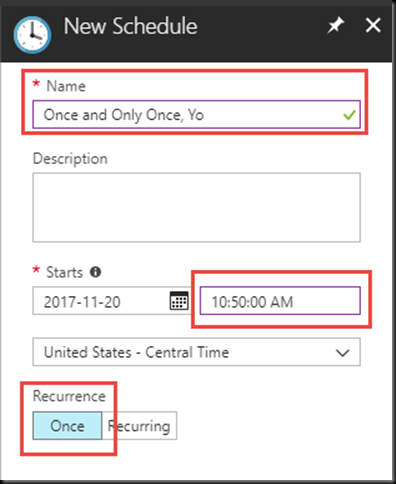
image

Give you schedule a meaningful name, ideally, one more meaningful than what I chose above. Note that you have to make sure the schedule is set to kick off at least 5 minutes into the future. Also, for this purpose, I am just choosing to have this execute Once.

Now we wait. Or, rather I wait, I guess. Anyway, back in a sec. Talk amongst yourselves. Here’s a topic: If Wile E Coyote could buy all that ACME stuff to try to catch the Roadrunner, why couldn’t he just buy some food?

And we’re back.

image

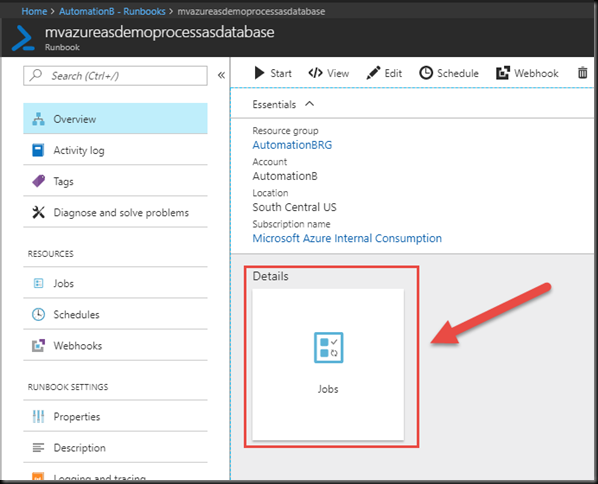
We can check the status of our scheduled Runbook execution by clicking on the Jobs button in the Runbook blade.

image

We can see it completed successfully. Hazzah! If we click on it, we can view more details.

image

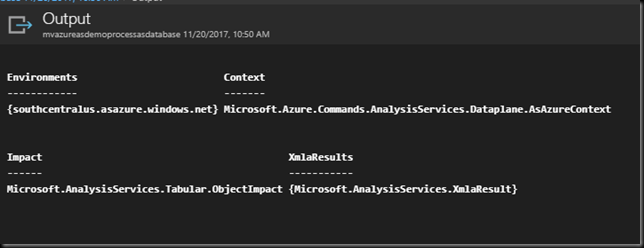
The Job Status is Completed. There are not Errors or Warnings. We can click on the Output to see the actual job Output, just like in the Test Pane.

image

Hazzah!

image

And we can see in the Database properties that the Last Data Refresh matches the time of our scheduled Runbook execution.

Hazzah! Hazzah!

Wrapping Up

There you have it. We just automated the processing of an Azure Analysis Services database using an Azure Active Directory Service Principal, PowerShell, and Azure Automation. Although this post is a bit long, the actual steps to make this happen aren’t very difficult. Hopefully, this will help walk you through trying this yourself.

Connect Suggestion: SSAS Tabular Images In Azure VM Gallery

Greetings, noble readers.

Currently, when utilizing the SQL Server images in the VM Gallery in Azure, any installations of SQL Server Analysis Services default to Multidimensional. Thus, if you want SSAS Tabular, you have additional work to perform.

I was just chatting with a Senior Program Manager on the SQL Server Analysis Services product team. They currently don’t have anything in their plans for providing SQL Server Gallery Images with SSAS Tabular instead of Multidimensional. We agreed that it is a good idea for that to happen. We also agreed that a Connect suggestion would be a great way to gauge broader community support/appetite for providing Gallery images with Tabular installed.

<insert fanfare and trumpets and stuff>

Below is the link to the suggestion I made on Connect.Microsoft.com. If you agree that having SQL Server Images in the Azure VM Gallery with SSAS Tabular already installed would be a good thing, please vote up the suggestion as it will help the Product Team to justify the effort it would take to do so. If you don’t have strong feelings either way, please vote it up for those of us that do. Smile

Provide SQL Server Image in Azure VM Gallery With SSAS Tabular Installed

Your participation in this endeavor is much appreciated.

Thank you for your support.

Introduction To Analysis Services Extended Events

I started digging into using Extended Events to trace Analysis Services recently for a client. They wanted to do some tracing of their SSAS instances, and with the deprecation of SQL Profiler, Extended Events was the best long term solution.

I have to admit, when I first started looking at this topic, I was overwhelmed. Other than a few blog posts, which I will list out below, there was very little to go on. I believe, on the whole, SQL Server Books Online (msdn, technet, etc) have pretty solid content. But for using Extended Events on Analysis Services, I have to agree with Chris Webb (Blog|Twitter) that BOL provides little value. Note: Although the examples I have seen in the wild, as well as my example below, have used SSAS Multidimensional, I implemented this for SSAS Tabular at my client. So, it works for both.

I will not be advising you on what events to trace for different purposes. I am afraid that is beyond the scope of this post and not something I have deep knowledge about at this point.

In researching this topic, I used the following blog posts:

Chris Webb (Blog|Twitter) – Using XEvents In SSAS 2012

Bill Anton (Blog|Twitter) – Extended Events For Analysis Services

Andreas Wolter (Blog|Twitter) – Tracing Analysis Services (SSAS) with Extended Events – Yes it works and this is how

Francesco De Chirico (Blog|Twitter) – Identify Storage Engine and Formula Engine bottlenecks with new SSAS XEvents

These posts were all helpful in one way or another. In some cases, I used a post as the source upon which I based the queries I used. When that is the case, I will make it clear where my base code came from. I do this because I am a vehement supporter of giving credit where it is due.

Extended Events for Analysis Services, unlike that for the database engine, lacks a graphical user interface. You have to work in code. Not only that, but the code happens to be XMLA. Yikes. I know there are people who are good with XMLA, but I am not among them. That was part of what gave me trepidation as I started down the path of working with Extended Events for SSAS.

For the CREATE script for my Extended Events trace, I turned to Bill Anton’s blog post listed above. That script not only includes the base syntax, but he also includes every event (I think it is all of them anyway) commented out. This allowed me to just uncomment the events I wanted to trace, but leave the others intact for easy use later. For this script, make sure you are connected to an SSAS instance in Management Studio, not Database Engine. Also, you will ideally be in an XMLA query window; I was able to run this code in an MDX window as well, but my examples below will assume an XMLA window.

Note: In XMLA, lines beginning with <!– and ending with –> are comments.

   1:  <!-- This script supplied by Bill Anton http://byobi.com/blog/2013/06/extended-events-for-analysis-services/ -->
   2:  
   3:  <Create
   4:      xmlns="http://schemas.microsoft.com/analysisservices/2003/engine"
   5:      xmlns:xsi="http://www.w3.org/2001/XMLSchema-instance"
   6:      xmlns:ddl2="http://schemas.microsoft.com/analysisservices/2003/engine/2"
   7:      xmlns:ddl2_2="http://schemas.microsoft.com/analysisservices/2003/engine/2/2"
   8:      xmlns:ddl100_100="http://schemas.microsoft.com/analysisservices/2008/engine/100/100"
   9:      xmlns:ddl200_200="http://schemas.microsoft.com/analysisservices/2010/engine/200/200"
  10:      xmlns:ddl300_300="http://schemas.microsoft.com/analysisservices/2011/engine/300/300">
  11:      <ObjectDefinition>
  12:          <Trace>
  13:              <ID>MyTrace</ID>
  14:              <!--Example: <ID>QueryTuning_20130624</ID>-->
  15:              <Name>MyTrace</Name>
  16:              <!--Example: <Name>QueryTuning_20130624</Name>-->
  17:              <ddl300_300:XEvent>
  18:                  <event_session    name="xeas"
  19:                                  dispatchLatency="1"
  20:                                  maxEventSize="4"
  21:                                  maxMemory="4"
  22:                                  memoryPartitionMode="none"
  23:                                  eventRetentionMode="allowSingleEventLoss"
  24:                                  trackCausality="true">
  25:  
  26:                      <!-- ### COMMAND EVENTS ### -->
  27:                      <!--<event package="AS" name="CommandBegin" />-->
  28:                      <!--<event package="AS" name="CommandEnd" />-->
  29:  
  30:                      <!-- ### DISCOVER EVENTS ### -->
  31:                      <!--<event package="AS" name="DiscoverBegin" />-->
  32:                      <!--<event package="AS" name="DiscoverEnd" />-->
  33:  
  34:                      <!-- ### DISCOVER SERVER STATE EVENTS ### -->
  35:                      <!--<event package="AS" name="ServerStateDiscoverBegin" />-->
  36:                      <!--<event package="AS" name="ServerStateDiscoverEnd" />-->
  37:  
  38:                      <!-- ### ERRORS AND WARNING ### -->
  39:                      <!--<event package="AS" name="Error" />-->
  40:  
  41:                      <!-- ### FILE LOAD AND SAVE ### -->
  42:                      <!--<event package="AS" name="FileLoadBegin" />-->
  43:                      <!--<event package="AS" name="FileLoadEnd" />-->
  44:                      <!--<event package="AS" name="FileSaveBegin" />-->
  45:                      <!--<event package="AS" name="FileSaveEnd" />-->
  46:                      <!--<event package="AS" name="PageInBegin" />-->
  47:                      <!--<event package="AS" name="PageInEnd" />-->
  48:                      <!--<event package="AS" name="PageOutBegin" />-->
  49:                      <!--<event package="AS" name="PageOutEnd" />-->
  50:  
  51:                      <!-- ### LOCKS ### -->
  52:                      <!--<event package="AS" name="Deadlock" />-->
  53:                      <!--<event package="AS" name="LockAcquired" />-->
  54:                      <!--<event package="AS" name="LockReleased" />-->
  55:                      <!--<event package="AS" name="LockTimeout" />-->
  56:                      <!--<event package="AS" name="LockWaiting" />-->
  57:  
  58:                      <!-- ### NOTIFICATION EVENTS ### -->
  59:                      <!--<event package="AS" name="Notification" />-->
  60:                      <!--<event package="AS" name="UserDefined" />-->
  61:  
  62:                      <!-- ### PROGRESS REPORTS ### -->
  63:                      <!--<event package="AS" name="ProgressReportBegin" />-->
  64:                      <!--<event package="AS" name="ProgressReportCurrent" />-->
  65:                      <!--<event package="AS" name="ProgressReportEnd" />-->
  66:                      <!--<event package="AS" name="ProgressReportError" />-->
  67:  
  68:                      <!-- ### QUERY EVENTS ### -->
  69:                      <!--<event package="AS" name="QueryBegin" />-->
  70:                      <event package="AS" name="QueryEnd" />
  71:  
  72:                      <!-- ### QUERY PROCESSING ### -->
  73:                      <!--<event package="AS" name="CalculateNonEmptyBegin" />-->
  74:                      <!--<event package="AS" name="CalculateNonEmptyCurrent" />-->
  75:                      <!--<event package="AS" name="CalculateNonEmptyEnd" />-->
  76:                      <!--<event package="AS" name="CalculationEvaluation" />-->
  77:                      <!--<event package="AS" name="CalculationEvaluationDetailedInformation" />-->
  78:                      <!--<event package="AS" name="DaxQueryPlan" />-->
  79:                      <!--<event package="AS" name="DirectQueryBegin" />-->
  80:                      <!--<event package="AS" name="DirectQueryEnd" />-->
  81:                      <!--<event package="AS" name="ExecuteMDXScriptBegin" />-->
  82:                      <!--<event package="AS" name="ExecuteMDXScriptCurrent" />-->
  83:                      <!--<event package="AS" name="ExecuteMDXScriptEnd" />-->
  84:                      <!--<event package="AS" name="GetDataFromAggregation" />-->
  85:                      <!--<event package="AS" name="GetDataFromCache" />-->
  86:                      <!--<event package="AS" name="QueryCubeBegin" />-->
  87:                      <!--<event package="AS" name="QueryCubeEnd" />-->
  88:                      <!--<event package="AS" name="QueryDimension" />-->
  89:                      <!--<event package="AS" name="QuerySubcube" />-->
  90:                      <!--<event package="AS" name="ResourceUsage" />-->
  91:                      <!--<event package="AS" name="QuerySubcubeVerbose" />-->
  92:                      <!--<event package="AS" name="SerializeResultsBegin" />-->
  93:                      <!--<event package="AS" name="SerializeResultsCurrent" />-->
  94:                      <!--<event package="AS" name="SerializeResultsEnd" />-->
  95:                      <!--<event package="AS" name="VertiPaqSEQueryBegin" />-->
  96:                      <!--<event package="AS" name="VertiPaqSEQueryCacheMatch" />-->
  97:                      <!--<event package="AS" name="VertiPaqSEQueryEnd" />-->
  98:  
  99:                      <!-- ### SECURITY AUDIT ### -->
 100:                      <!--<event package="AS" name="AuditAdminOperationsEvent" />-->
 101:                      <event package="AS" name="AuditLogin" />
 102:                      <!--<event package="AS" name="AuditLogout" />-->
 103:                      <!--<event package="AS" name="AuditObjectPermissionEvent" />-->
 104:                      <!--<event package="AS" name="AuditServerStartsAndStops" />-->
 105:  
 106:                      <!-- ### SESSION EVENTS ### -->
 107:                      <!--<event package="AS" name="ExistingConnection" />-->
 108:                      <!--<event package="AS" name="ExistingSession" />-->
 109:                      <!--<event package="AS" name="SessionInitialize" />-->
 110:  
 111:  
 112:                      <target package="Package0" name="event_file">
 113:                          <!-- Make sure SSAS instance Service Account can write to this location -->
 114:                          <parameter name="filename" value="C:\SSASExtendedEvents\MyTrace.xel" />
 115:                          <!--Example: <parameter name="filename" value="C:\Program Files\Microsoft SQL Server\MSAS11.SSAS_MD\OLAP\Log\trace_results.xel" />-->
 116:                      </target>
 117:                  </event_session>
 118:              </ddl300_300:XEvent>
 119:          </Trace>
 120:      </ObjectDefinition>
 121:  </Create>

You can download a version of this script without line numbers here.

I modified Bill’s original script for my own purposes in a few places.

I used my own Trace ID and Trace Name in lines 13 and 15 respectively.

  12:          <Trace>
  13:              <ID>MyTrace</ID>
  14:              <!--Example: <ID>QueryTuning_20130624</ID>-->
  15:              <Name>MyTrace</Name>
  16:              <!--Example: <Name>QueryTuning_20130624</Name>—>

I uncommented the Query End event on line 70 as well as the AuditLogin event on line 101 since those were the events I wanted to trace, to keep things simple. 70: <event package=“AS” name=“QueryEnd” /> 101: <event package=“AS” name=“AuditLogin” /> I put my own output file path on line 114. 114: <parameter name=“filename” value=“C:\SSASExtendedEvents\MyTrace.xel” /> I also added a comment on line 113. 113: <!– Make sure SSAS instance Service Account can write to this location –> I did this because I tripped over this myself. I initially got an Access Denied message when running the script above. Once I gave my SSAS instance service account rights to modify the C:\SSASExtendedEvents folder, I was good to go and the trace started just fine. When you execute the query, your Results pane should look like the screenshot below. This indicates success. Gotta love XMLA, huh? image You can verify your Extended Events trace is running by executing the following query in an MDX query window connected to the same instance in which you started the trace. The query below is in all of the blog posts referenced above.

SELECT * FROM $system.discover_traces


My results for this query looked like this:

image

Note the line highlighted in the red rectangle indicates “MyTrace” and the type is XEvent. Hazzah! You can also take a look at the destination folder specified for your output file. In my case, that is C:\SSASExtendedEvents, shown below.

image

There are two files here because I kept the output file from a test run earlier. I did that to show you that the function I will use to import this information into a tabular form in the database engine can iterate over multiple files easily. You will note that the engine added lots of numbers to the filename. I have not run this long enough to spill over into multiple files, but I am assuming the _0_ would refer to the first file in a tracing session. As in, the next file would have the same name, but with _1_, the next file _2_, and so on. But, that is just a guess. The long string of numbers after that seem to just be there to make sure the trace file name is unique.

OK. So, we have an Extended Events trace running. Now what? Well, let’s run some queries. In my case, I just ran some of the MDX queries from my MDX Trek: First Contact presentation. The queries themselves don’t really matter. Just query a database in your SSAS instance in some fashion.

Reading from the xel file in code (as opposed to manually in Management Studio) involves one of two processes I am aware of.

1. The sys.fn_xe_file_target_read_file function followed by shredding some XML. This function was mentioned by Bill Anton and Francesco De Chirico in their posts.

2. Jonathan Kehayias (Blog|Twitter) mentioned to me, on Twitter, the use of the QueryableXEventData class via .Net code. He stressed that this is his preferred method as it is much faster then using the sys.fn_xe_file_target_read_file function and then the XML shredding.

Trusting Jonathan on Extended Events, among many other topics, is a good idea. However, not being a .Net person, and wanting to post this while it is fresh in my mind, I am going to demonstrate the first method. I did find that method 1 is not ultra speedy, to be sure. But for the moment, event at my client, it will serve. I do intend to dig into the .Net and perhaps blog that when I do. 🙂

In Francesco De Chirico’s post, he not only discusses the use of the sys.fn_xe_file_target_read_file function to read in the xel files, but also provides great examples of the XML shredding. XML and I have an understanding: we both understand that I am horrible at XML. 🙂 So, the fact that Francesco provided the XML shredding syntax was a great find for me.

   1:  /****
   2:  Base query provided by Francesco De Chirico
   3:  http://francescodechirico.wordpress.com/2012/08/03/identify-storage-engine-and-formula-engine-bottlenecks-with-new-ssas-xevents-5/
   4:  
   5:  ****/
   6:  
   7:  SELECT
   8:        xe.TraceFileName
   9:      , xe.TraceEvent
  10:      , xe.EventDataXML.value('(/event/data[@name="EventSubclass"]/value)[1]','int') AS EventSubclass
  11:      , xe.EventDataXML.value('(/event/data[@name="ServerName"]/value)[1]','varchar(50)') AS ServerName
  12:      , xe.EventDataXML.value('(/event/data[@name="DatabaseName"]/value)[1]','varchar(50)') AS DatabaseName
  13:      , xe.EventDataXML.value('(/event/data[@name="NTUserName"]/value)[1]','varchar(50)') AS NTUserName
  14:      , xe.EventDataXML.value('(/event/data[@name="ConnectionID"]/value)[1]','int') AS ConnectionID
  15:      , xe.EventDataXML.value('(/event/data[@name="StartTime"]/value)[1]','datetime') AS StartTime
  16:      , xe.EventDataXML.value('(/event/data[@name="EndTime"]/value)[1]','datetime') AS EndTime
  17:      , xe.EventDataXML.value('(/event/data[@name="Duration"]/value)[1]','bigint') AS Duration
  18:      , xe.EventDataXML.value('(/event/data[@name="TextData"]/value)[1]','varchar(max)') AS TextData
  19:  FROM
  20:  (
  21:  SELECT
  22:        [FILE_NAME] AS TraceFileName
  23:      , OBJECT_NAME AS TraceEvent
  24:      , CONVERT(XML,Event_data) AS EventDataXML
  25:  FROM sys.fn_xe_file_target_read_file ( 'C:\SSASExtendedEvents\MyTrace*.xel', null, null, null )
  26:  ) xe
  27:  


In line 25, note that the file target indicates MyTrace*.xel. This is because the latter part of the file name(s) will not necessarily be known. The MyTrace*.xel tells the function to iterate over all files matching that spec. Thus, when I run this query, it will pull the data from both of the files shown earlier in my C:\SSASExtendedEvents folder.

In Line 24, we are converting the Event_Data column, which the function returns as an nvarchar(max), into XML to enable use to use the value() method.

Please note that I am not pulling all of the information available in the xel file. I am just pulling the fields I cared about for my purposes. There is more in there. And that will vary depending on the events you choose when creating the trace.

When I run this query, I get the following:

image

I can use this, like I did at my client, to insert into a SQL Server database table for later analysis. We are actually planning a Tabular model on this data to help track usage of their BI offerings in their organization. That will be fun to play with.

Once you are ready to stop the trace, execute the following XMLA:

   1:  <Delete xmlns="http://schemas.microsoft.com/analysisservices/2003/engine">
   2:      <Object>
   3:          <TraceID>MyTrace</TraceID>
   4:      </Object>
   5:  </Delete>


That’s about it. I hope this proves to be a meaningful addition to what is available for working with Extended Events on Analysis Services. It was certainly a great learning experience for me.

Survey: Changing Model.bim Filename In SSAS Tabular Projects

I am working for a client that has several Tabular models and are developing more. Even thought the process of developing Tabular models in SSDT could use some improvement, I am happy to see this exciting technology being adopted.

I noticed that the models here are pretty much all called Model.bim in the project. I have typically renamed mine to provide better context and never encountered an issue. My thinking was based on the multi-dimensional world in which a Cube called Cube is pretty ambiguous as to what information it contains. Likewise, a table called Table or a database called Database. Those examples are a little different, though, since a tabular project can only contain ONE .bim file at the moment.

William Weber (Blog|Twitter), with whom I am working on this project, pointed out that Books Online indicates that the name of the bim file should not be changed:

image

There is so little detail here as to make me question what could happen. I reached out in general on Twitter and no one seemed to have a good explanation. Today I asked SSAS Program Manager Kasper de Jonge (Blog|Twitter) directly. Kasper knew of no specific issue, either, and suggested it was probably just not tested. Fair enough.

Although, there does seem to be some gray area here. With this post, my hope is that we can eliminate some of the gray and provide better clarity around this for all of us. I would appreciate responses to this in comments.

1. Do you rename your Model.bim file and why/why not?

2. If you do rename it, have you had issues as a result? If so, what issues?

Thanks.

PASS Summit Interview With Kamal Hathi

For the third, and final, installment in my PASS Summit Interview series, I present my interview with Kamal Hathi, Director of Program Management for Business Intelligence Tools at Microsoft. Kamal is the one who is ultimately responsible for the direction of Microsoft BI.

As with my other interviews, the byproducts of casual conversation have been edited out for better flow in writing.

Transcript

Mark V:

Things are changing very rapidly in the BI space. There are so many tools coming out and Microsoft is delivering so many awesome new features. As a BI Developer, what does my job look like 5 years down the road?

Kamal:

That’s a great question. I think we’ve been on a journey where BI was something central that somebody built and everybody sort of just clicked and used, or maybe had a report. Now, we’re coming to a point where a lot of it is empowered by the business. The business guy can go off and do lots of things. But there’s two parts that are interesting that a Developer, a Professional, if you will, needs to be in the middle of. One, I think, is the data. Where does the data come from? The first requirement is having the right data. And call it what you want, Data Stewardship, Data Sanctioning. And it’s not just Data meaning rows and columns or key-value pair kinds of things. I think there’s Data, as in the Data Model; building a Data Model. And a Data Model, sometimes, is not different than what people do building Cubes. They have Hierarchies, and they have Calculations, and they have interesting drill paths. All kinds of things. So, someone has to go do that work, many times. Even though, I think, end users can go and mash up data themselves. But there are times when you need a more supervisory nature of work; or a more complicated nature, if it turns out that Calculations are difficult, or whatever. Someone’s going to always do THAT work. And that’s interesting. The second piece that is Interesting is that I think there’s going to be a new work flow. We’re already seeing this pattern in many places. The workflow is going to be like this. An End User decides they want to build a solution. And they go off and, essentially, put something together that’s very close to what they want. But it’s not really high performance; it’s not perfect. Maybe it’s got some missing things. And they use it. And their peers use it. It gets popular. And then some Developer comes in and says, “Let me take that over.” And then they improve it, make it better, polish it up. Maybe completely re-write it. But they have the right requirements built in right there. A third piece you will start seeing is going to be the Cloud services based world. That is taking bits and pieces of finished Services, and composing then together to build solutions. And that’s something we don’t see much today. But I can imagine someone saying, “Hey, I’ve got this Power BI piece which gives my visualization, or some way to interact. I can take some part of it and plug it in to another solution. “ They can provide a vertical solution, provide a customized thing for whatever audience it is. And be able to do so. I think those kinds of things will be much more likely than doing the whole thing.

Mark V:

So, instead of necessarily the BI Developer working with the users to help map out requirements, with these End User tools, they can build something that’s their requirement.

Kamal:

More or less. And then the Developer can jump in and make it better. Maybe re-write better expressions and queries and make it faster; all kinds of interesting things. It just adds more value to their job. Instead of sitting there talking to people and getting “Oh, this is wrong. Re-do it.”

Mark V:

When Tabular came out, there was some uproar. When a new feature comes out, there are always “the sky is falling” people that say that something else must be going away. It happened when Power View came out. People said, “Report Builder is going away.” Then, when Tabular came out, “Oh! Multidimensional is going away.” I still hear it out there sometimes that Multidimensional is dead or dying; MDX is dead or dying. What message do you have for those people?

Kamal:

Two things here. MDX and Multidimensional are not the same thing. We should be very careful. Multidimensional is very important. Lots of customers use it. And we’re actually making improvements to it. This latest thing, DAX over MD, which allowed Power View to work over Multidimensional, is a great example. We know this is important. There are many customers who have very large scale systems in Multidimensional. And it’s important to us. We’ve just come to a point with Multidimensional where large jumps in functionality are just harder to do. You can really go on an say we can 10X anything. And so the In-memory stuff, the Tabular, has been the approach we’ve taken to give more kinds of scenarios; the more malleable, flexible stories, the “no schema design up front” kind of approach. But Multidimensional is super important. It isn’t going anywhere. So, when someone asks, “What should I use?” we say, “You pick.” Our tools, our aim is, should work on top of either. We would like Tabular to be on parity with Multidimensional in terms of capabilities. And we’re making progress. We’re getting there. We haven’t quite gotten there. But uses shouldn’t have to worry, in our opinion, about Multidimensional or Tabular. These should be things that you worry about as a tuning parameter, but you shouldn’t have to worry about them as a big choice.

Mark V:

So, the Business shouldn’t be concerned about it.

Kamal:

Right. It’s a store. It’s a model. It’s a calculation engine. And you might want to switch one to the other. And in the future, that could be a possibility. There are lots of limitations that might not make that practically possible, but notionally speaking. I’m not saying you could just pull a switch. But you should be able to have similar capabilities and then decide which one to use.

Mark V:

Or possibly some kind of migration tool?

Kamal:

Yeah, but those kinds of things are harder sometimes. They’re not so easy to do because.. who knows what’s involved? What kind of calculations did you write? Etc. Those are much harder to do. Migration is always hard. But comparable capabilities make a lot more sense. So, I can take this guy, and build the same thing and not have to worry about a dead end.

Mark V:

When I was at TechEd, Kay Unkroth did a great Managed BI session. And he started with a demo of taking in data from the Internet and combining it with some business logic. It was tracking the purchasing habits of Pink Panthers buying cell phones. And in his scenario, they went through a big investment at this Company only to find out that Pink Panthers don’t exist. So, in the realm we have, with data becoming more self-serve, with Power Query, etc, being able to reach out to more and more places, what is the thinking [from Microsoft] on the ways we can continue to have some governance over the realm that users have?

Kamal:

Fantastic. This question goes back to the first question on what Developers do. We talked about Data Stewards and Sanctioned Data and all that. And even with Power Query, if you work with that, the catalog you find things from isn’t just the Internet. The Internet is one catalog. We are also enabling a Corporate, internal catalog, which today, we showed in the keynote. And you saw what we can do. It’s in Power BI, and you can actually try it out. And the goal there is to find a way for someone, it could be a business user, maybe a Developer, the IT professional, to go off and add to a catalog that is internal to the company. They can add something they think is trustworthy and worth sharing. And then someone else can come in. And they want the shopping habits of certain constituencies or a certain segment, they can find it. As opposed to “I heard on YouTube that 20-inch phones are now hot.” Who knows, right? Just because it’s on the Internet, doesn’t mean it’s true. That’s the idea of having this info catalog, essentially. It knows how to provide people the capability of publishing. And that can be a mechanism for whoever one deems fit in the process to provide that sanctioned publishing. And maybe have a data curator look at things and make sure users have a place they can go for trusted sources as opposed to “wide open.” And we actually enable that. People can do that.

Mark V:

Could you then disable the Internet piece of that catalog in certain organizations?

Kamal:

Potentially. The question is Why? And, again, it’s a process thing. You ask people Why and what they want to do. And that’s the danger of governance. The minute you make something such that it becomes that Forbidden Fruit, someone will find a way of doing it. They’ll go out and Cut and Paste. They’ll do something. It’s almost impossible to really lock these things down. What you do want is people to be aware that there’s an alternate, a sanctioned place, where they can go compare and they can understand. And that’s what they should be doing. I think it’s much harder to lock it down and say you can only get data from inside. But that’s a process view; and organization will decide how they want to do it.

Mark V:

Early in my career, I built several report models for clients. Obviously, you know, they’re going away. They’re not be invested in. I recently wrote a Technical Article about alternatives to Report Models in SQL 2012. And I laid out the different options that you have, from Power Pivot for Excel, Power Pivot for SharePoint, Tabular, or full on Multidimensional, etc. One of the things that was pointed out to me after that one of the things that goes away with report models is the ability to make that regular detail style table report in Reporting Services that can go against a drag and drop model that’s not a Pivot table. Is there something coming down the road that could alleviate that?

Kamal:

There are ranges of this, right? You can do a drag and drop tablix, even, in Power View. So, it’s not like it’s completely gone.

Mark V:

Right. It’s not completely eliminated. But it’s not the flexibly of a Report that you can do subscriptions with, etc.

Kamal:

I think in terms of those kinds of things, like Subscriptions, mailings… Two things. One. Reporting Services is still there. It’s not like it’s gone away. And number two, we obviously think it’s important to have the same capabilities in other places and so we’re looking into making that possible. A lot of people ask for it. And it seems like a reasonable thing to ask for. Why would I not want to go schedule even my Excel sheets? A report’s a report. For some people a report is a Reporting Services report. For some people a report’s an Excel report. It’s an important point and certainly we’re looking into that as something we would do. But I don’t know When, Why, How, Where. As with all things Microsoft, it’s open to interpretation by whichever tea leaf you read about.

Mark V:

From the visibility you have within Microsoft to see what’s going on, could you describe, in a general sense, how a feature for, say, Analysis Services, goes from ideation, with someone saying, “Hey, wouldn’t this be cool?” to making it into the product?

Kamal:

Absolutely. There are multiple ways this happens. One is when we had an idea before or a customer had asked for it, and we decided to ship it and couldn’t. And then it becomes a “backlog” feature. So, next time, when the next version comes, this one is left over and we say, “Hey, come join the train.” We just pull them back on. That’s easy. Done. Everyone knew we wanted, or tons of people had asked for it, and we just couldn’t finish it, so we just put it over. The second, which is much more likely, is customers have been asking for something. For example, we heard the feedback loud and clear, “We need support for Power View of Multidimensional models.” That’s a pretty clear ask. The work is not easy, but it’s a pretty clear ask. So then you go and say, “What does it take?” We figure out the details, the design, the technical part of it. And then you figure out the release timeframe, the testing. All that stuff. And you do it. The third one is when somebody say, “I have an idea.” For example, “I want to do something. I have an idea for an in-memory engine and it could be like a Power Pivot.” And that’s just like, “Wow! Where’d that come from?” And then you say, “Will it work?” And nobody knows, right? So then we start going in an asking customers what they think. Or, more likely, that idea had come from talking to somebody. And this Power Pivot case actually came from talking to customers that said, “Hey, we want end users to be more empowered to do analysis themselves. What can you do?” That was essentially the germination of that idea. When that happens, there’s usually some customer input, some personal input. And then they start to come closer to fleshing it out and ask who’s going to use it. So we ask customers, get some replies. Sometimes we just do a design on paper and say, “Would you use this?” And then people try it out, give it some feedback, and say, “Yeah. That’s good.” So, we go down this path getting more and more input. And then we come up with a real product around it. Sometimes, we have an idea that we think is great and we float it around and we hear vocal feedback saying that’s a bad idea. And we go back to the drawing board and re-do it. And this happens all the time. Many of these features show up, and people don’t realize that we went back and re-did it because the community told us. And many people ask if we use focus groups here [at PASS Summit]. There’s one tomorrow, actually, to go sit down and say, “What do you guys think about XYZ?” There’s feedback; and we listen. So, there’s an idea, there’s feedback, there’s evolution. And we iterate over it all the time until we come to a solution on that. Very rarely to we just build something where we didn’t ask anyone and we just did it. We come up with a brainstorm and flesh it out, but we always get feedback.

Mark V:

So, Matt Masson has discussed the debate within the SSIS team regarding the Single Package deployment model versus the new Project Deployment model. I would assume that happens throughout all the products. Maybe there’s somebody championing this feature and people asking “What are we going to do?”

Kamal:

Yeah. My first memory of working on this team is people shouting in hallways… in a friendly way. People shouting, “Hey! What about THIS?” or “What about THAT?” And it turns out to be a very vocal and a very passionate environment. People don’t just work because they walk in in the morning and write code. They work on this because they are just in love with this product. They are just deeply, deeply involved and committed to what they’re developing. And these people just have opinions. And I don’t mean opinions like “Yeah, I want to have a hamburger.” They have an OPINION. And there are very passionate discussions that go back and forth and back and forth sometimes. Typically what happens is a Senior Architect or someone who has some tie-breaking capability can come in and say, “Look, great ideas everybody, but we’re going to do THIS.” And then people listen, there’s some more argument, and after that, it’s done. And we go and do it. And Power Pivot is a great example of that. People were like, “Are you crazy? What are you doing??” And it was like, “No. We’re going to do it.” And that was it. And the team just rallied behind it and built a great product, and off we go. But, the good part about that story is that, because people have such vocal opinions, they rarely remain silent about these things. We don’t lose anything. And so we have an answer that we can listen to. And we can decide from multiple options as opposed to just going down one path. And then we end up with a decent, rigorously debated solution.

Mark V:

So, there’s a lot going on right now with Cloud and Hybrid solutions; there’s Chuck Heinzelman’s great white paper on building BI solutions in the Cloud in Azure virtual machines. When I talk about that with clients or with colleagues, there’s still a lot of trepidation and people say, “For some industries, that will never ever happen.” What kind of message would you have for people that just don’t see how it’s feasible?

Kamal:

Cloud has many aspects to it. There is the “Everything’s in the Cloud. I want to put my financial, regulatory data in the cloud.” Which, is not going to happen for some people. Then there is the “I can get value form the Cloud on a temporary or on-demand basis. I want to go burst capacity. I want to go off and do a backup.” Whatever it is. There’s that. Then there is the “I’m going to do some parts of my workload in the cloud and the rest will remain on premise.” And for all these options, whether it’s completely in, hybrid, temporary bursting, that value provided is typically what customers decided makes sense for them. If it’s the value of all the infrastructure just being taken care of and I can do more things to add value to a solution, so be it. If it happens to be that I can get extra capacity when I need it, great. If it happens that I can keep my mission critical or compliance related data on premise and lock it up, and hybridly work with the cloud, that also works. And for most customers, most users, there is value in many of these scenarios. And there isn’t any one answer. You can just say that “The Cloud” means that you do X. it just means that you have many options. And interestingly, Microsoft provides many options. We have Platform [PAAS], fully deployed platforms that you pretty much just deploy your database and have to do nothing. Azure SQL Database, good example. All you do is worry about building your database, setting your tables, and you’re done. We take care of all kinds of things in the background. Don’t like that? Go to a VM. And you can do all kinds of fancy things. Chuck’s paper is a great example. We have solutions. Office 365 gives you end-to-end; from data to interfaces to management, all in one. Each of these things have hybrid solutions. You can have data on premise. As we saw today in the keynote, you can backup to Azure. With 365 and Power BI, you can actually do hybrid data connectivity. So, all of these things work in different ways. I think, for every customer out there, it typically is just a trial solution, they want show something, or they want to have part of their solution that works. Either way, it adds value. Typically, what I have found as I talk to customers, is that many of them come from the “I would never do that” to “Oh. I might try that.” Because they have come to the realization that it’s not an all or nothing proposition. And you can do parts, try it out, and it works.

Mark V:

Over the Summer, I did a proof of concept for a client using Tabular. Just because, with the size of it, and looking at its characteristics, I said, “This would be a great Tabular solution. Let me demo it for you.” I have talked to several people in the industry. And the process of developing Tabular in SQL Server Data Tools can be… less than awesome. I had some bumps in the road. There was a great add-in I got from CodePlex [DAX Editor] that helped me deal with DAX in more of a Visual Studio environment. It didn’t apply well to Service Pack 1 [of SSAS 2012 Tabular] and that kind of stuff. There was something that Marco Russo had put forth on Connect that suggested more or less a DDL language for Tabular models. Is something like that feasible?

Kamal:

I don’t know. I don’t have a good answer for that. That reason for that is we’re looking at many options. What would move the ball forward in that direction for a design environment for Tabular models? And there are many options. So would say let’s do it in Excel; take Power Pivot and put it on steroids. It’s a possibility. Or a DDL language. Go off and take the things you had in MOLAP and apply it here, maybe. Maybe something brand new. I don’t know. We’re trying to figure out what that is. I do know that we do want to take care of people who do large scale models, complex models in this environment. I just don’t know how and where and when. But it’s an important constituency, an important set of customers. And we’ll figure out how to do it.

Mark V:

As a BI developer, it’s important to know that the discussion’s being had.

Kamal:

All the time. This happens in a lot of hallway discussions. This is one of those.

Wrapping Up

There’s a little bit of a story to this one. When I decided I wanted to do a blog series composed of interviews conducted with Microsoft folks at the Summit, I wanted to get different perspectives. With Matt Masson (Blog|Twitter) and Kasper de Jonge (Blog|Twitter), I already had members of teams in the trenches of development of the tools. I had then reached out to the awesome Cindy Gross (Blog|Twitter) to get the perspective of someone on the CAT (Customer Advisory Team). Cindy got back to me with a contact for Microsoft PR, Erin Olson, saying that she was told to send me there. Upon contacting Erin, she responded by offering to have me sit down with Kamal Hathi, who would already be on site that day. That was an offer I couldn’t refuse. In hindsight, I am wishing I had asked about sitting down with Cindy as well, but I had already decided that my first series of this sort would be capped at 3 since I had never attempted anything like this before and didn’t know what to expect. If this series proves to be popular and of value to the Community, then I will certainly consider doing it again and asking Cindy to participate.

You will notice some overlap in the questions posed to my fantastic interviewees, particularly between Kasper and Kamal. I wanted to get different perspectives from within Microsoft on some similar topics. I also made sure to branch out in each interview and ask some questions targeted to a particular person.

In response to my “5 years down the road question,” Kamal echoed the importance of Data Stewardship. It is clear that this is an area that Microsoft is taking very seriously. Having done a lot of reporting in my career, my motto has always been, “It HAS to be right.” Clients have appreciated that. As we open up more and more avenues for users to get data, we must keep in mind that the data needs to be trustworthy. 

I really want to highlight the ways in which Kamal described how a feature makes it into the product. Make special note of the fact that customer feedback is vitally important to Microsoft. Sometimes, the idea itself comes from Customers. I think Microsoft often gets a bad wrap as some kind of bully or something merely because it is big. It is certainly not perfect; no company is. But I think it is really important to make note of how Microsoft DOES listen to customer feedback when it comes to the products they provide.

Kamal’s description of the internal debates that occur within Microsoft over features is important. It also echoes what we heard from Matt and Kasper. The people working on these products for us care VERY deeply about what they are doing. The work and passion that go into creating these tools we use every day is staggering to me. While I have never been a “fan boy” of any company, I have chosen the SQL Server related technologies upon which to base my career. And I have no regrets. This is a hugely exciting time to be a BI professional. The investments that Microsoft have been making in this space over the past several years make it even better.

This concludes my PASS Summit Interview series. Thanks so much to Matt Masson, Kasper de Jonge, and Kamal Hathi for taking time out of their very busy schedules to sit down with me and answer my questions. Thanks also to Cindy Gross and Erin Olson for their assistance in connecting me with Kamal. This series turned out even better than I had ever expected thanks to the generosity of those involved.

PASS Summit Interview With Kasper de Jonge

I continue on with my Interview series with Analysis Services Program Manager Kasper de Jonge (Blog|Twitter). As before, some edits were made, with Kasper’s permission, to eliminate byproducts of casual conversation and make things flow better in writing.

Transcript

Mark V:

How would you say my job as an SSAS developer would be different in five years?

Kasper:

Before I joined Microsoft, I was a developer, myself. I developed Analysis Services Cubes and SSRS reports on top of them. And they never seemed to work very well together. One of the things I have seen over the years, since I joined Microsoft, is the Teams started working together better, much better. So, teams like Power View and Analysis Services are coming together in releases, and now Power Query and the Data Steward experience join the mix. But I think that is one of the key aspects going forward.

I have been trying to sell MS BI before joining Microsoft, and it was hard. What do you need if you want to buy MS BI? You need Excel, so you need an Office license key, you need SharePoint, you need Analysis Services, you need Enterprise Edition, or BI Edition now, luckily we have that. So, you need to sell four different products. Now you can just say, we have one product: Power BI.

It’s gradually going. Power Query is still a little bit separate. The M language is there, then there’s the DAX language, and what do you do where? But at least we’re landing. The first thing we said two years ago was that there’s only going to be one model. And that’s the Analysis Services model. In the past, Reporting Services had their own model, right? The SMDLs [Semantic Model Definition Language]. Performance Point had their own models. They all had their own stuff. So we said, “No More. There’s only going to be one model, and that’s going to be Analysis Services.” That’s already a big step. You see people like Power Map come into the picture. The initial versions that were not public were not really connected to our stuff. We sat down together and said, “Let’s be sure we all do the same thing.” So, if you go into Power Pivot, and you say this column is a country, tag it as a country, not only can Power View use it, but Power Map will now use it as well. I think that’s one of the biggest benefits and it was really needed: to make one product, and make them work much better together.

Mark V:

Do you see big changes in the skills of people like myself, not an Information Worker, but someone who sets up the environments in which the Information Workers play?

Kasper:

I don’t really think so. I think the role is going to change a little. And that’s not necessarily to say that you’re going to have to do different things. But in the recent years, as there’s less IT, more cutbacks in IT, you have to do more things in less time. So, enabling the Business User is becoming more and more important. And not just by giving them canned reports, but by giving them better models, which we already did with Multidimensional Models for years. But make it even easier, and that means making good models in either multidimensional or Tabular, and have a good analytical platform on top of that. So, that’s one kind of user who only wants to do template reports or ad hoc visualization on top of models. That kind of stays the same, I think. I do hope that with Tabular models, it’s becoming easier to do shorter iterations, and we can grow the Tabular model over time and make it easier to use and make it easier to do larger things. For example, I have seen people that have six to seven hundred measures in their Tabular model. And that’s pretty hard to maintain. So, we need to come up with stuff to make that easier. I met someone yesterday that had 120 tables and five hundred measures. Well, right now, we don’t have a great experience for you to build and manage that. So we need to think about what that means. It’s more about how the tools change. I’m a PM [Program Manager] who works on the tools side of things. So, that is one aspect of the BI Pro as we know them today.

On the other side of things, with data movement, as Matt Masson was showing earlier today, you can expose data for your users to start using inside Power Query. And you can enable data steward to start creating data. So, you, as IT, are not necessarily building it, but you are starting to enable people. And I remember, back in the day, when I was building cubes myself, I built an application in .Net that allowed business users to add data to the data warehouse. Master Data Services does it now pretty well. So, the two types of Business Users, one being the user that just wants to do reporting, doesn’t want to do any modeling themselves or any calculations. So, that’s one. The other is the actual Power Pivot/Power Query user and we can help them get to the right data easily and make them confident that the data is right. And that’s an important venue. And I think that’s also an important part BI pros have been doing for years. They can shift a little bit into that mindset, and enable that as well.

Mark V:

From a tools perspective, one of the questions I have around enabling the end user to get more and more data, including data directly from the Internet. One of the things you talked about is the experience for the data steward with Master Data Services. Is there discussion around a solution that allows users to get data from the internet, but only so much. Kay Unkroth, at TechEd, did a great session around Managed BI. In that session, a fictitious company tracked the purchasing habits of Pink Panthers. And it wasn’t until a large investment had been made that someone realized, “Oh no. Pink Panthers aren’t real.” So, the experience of getting to more data. But how do we make sure it’s good?

Kasper:

There are definitely discussion about all of that. And you already see it a little bit in the portals. If you saw Matt Masson’s session today, you saw that you can track how many times different data has been used, and by whom. And we have that On-Prem today. And, in my mind, that is one of the most popular things. To allow you to understand what the data means. And I sincerely hope, and I am not sure if this is coming, but things like Data Lineage would make a lot of sense in here as well. I don’t know if you’re familiar with Prodiance? That’s something that the Excel team has. And it’s already released in Excel 2013. And it allows them to do, sort of, Excel spreadsheet lineage focused on the financial markets. I don’t know if you remember, this was a few years ago, and someone made an error in some calculation in an Excel spreadsheet and they lost a few billion dollars. So now all banks, etc, are saying, “OK. We need to manage this.” So they [Excel Team] have a product they bought, I think two years ago, called Prodiance. And it’s now available inside Excel. They only discover Excel workbooks for now and they don’t know anything about data models and everything that goes into that. So, it would be great if we could “hook that up” for example. I’m not saying that we’re doing that. But that’s something that would make sense.

Mark V:

So, with the way that Office and Analysis Services are dovetailing more, like in Power BI, is there sometimes contention between the teams?

Kasper:

No. The Office team loves what we’re doing. We’re adding value to Office. We’re giving them all kinds of new features. And we’re innovating in the BI space. And they love that. They do give us some hints and tips on what they want to see and we try to accommodate that. It’s more like working together. Our directors are working together and they see what is needed and say, “How do we work together on doing this?” We all see we’re working together in the Excel code base. But what do you think about Power BI? It’s one completely shared code base. You have Office 365, SharePoint Online, all the infrastructure. It’s one big surface that lives and breathes together. So, it’s a lot of working together.

Mark V:

That has to be pretty exciting.

Kasper:

Yes. I mean, it’s a big company. The Office team has its own building. It’s a little bit different. Each team has its own rules, and how it works, and it’s different. Office has a longer planning period. We don’t have a long planning period. In the past, we also had different shipping vehicles. Now this is more streamlined.

Mark V:

So, with the evolution of Analysis Services to feature both the Multidimensional and now the Tabular model, I encounter people who say, or have heard others say, “Multidimensional is dying” and “Don’t bother learning MDX because it’s not going to matter anymore” and so on. What kind of message would you have for those people?

Kasper:

My next session, in an hour, is about all the investments that we made in multidimensional that allow you to do Power View over Cubes. And that was not easy improvement. So, we now support DAX queries on top of Multidimensional Cubes. That is some major major work that has happened. We’re saying, now you have all the good stuff with Power View. And whenever Power View does something going forward: you will get it. Automatically. So, it’s definitely not that. Having said that, it’s still a hard decision on when to go for what. Multidimensional is just a much more mature product. It’s been in the market for so long. People have worked with it for all these years. With Multidimensional, we’ve seen all these different usage types.  We’ve seen the Yahoo cubes, the huge ones, the small ones, we’ve seen people do Writeback, and all those kinds of things. So, it’s been around the block. Tabular has not been around the block for long. It just started the journey. So, we’ll see where that ends up. I’ve heard some feedback from people here as well. They did multidimensional cubes and they started Tabular and said, “Well, it’s just great because it makes it so easy and makes it so fast to build something.” But it doesn’t have certain features. That’s for sure. Calculated Members would make my life so much easier. I wouldn’t have to do 400 measures. If I have Calculated Members, I could just have a few Calculated Members, and I’m done. I don’t have to do YTD for this measure, and this measure, and this measure. And when I do custom rollups, you can’t do it in Tabular. There’s just some things in Tabular that you cannot do yet. For example, Hierarchies. Get me the Parent of something. In Multidimensional, is makes sense because you have Attribute Relationships and you have Hierarchy structures. In Tabular, we don’t. We just have Tables. We have Hierarchies there, but hierarchies are more an “ease of use” feature instead of a structural feature, like it is in Multidimensional. So, there’s just a lot of things that haven’t made it. We don’t know if we want to bring that in to Tabular. So, it’s not that, that’s for sure.

Mark V:

Multidimensional is not going away.

Kasper:

No. It’s certainly not going away.

Mark V:

So, with MDX being as complicated as it is, and even though it would take years to get really good at MDX, is it still worthwhile path to go down since there is still so much multidimensional out there?

Kasper:

Yes.

Mark V:

And there are still so many use case for Multidimensional, even with Tabular.

Kasper:

And Excel still talks MDX even to Tabular. There are so many tools out there that talk MDX. But, having said that, I’ve heard a lot of people here that said, “I’ve migrated a lot of Multidimensional Cubes to Tabular Cubes. It makes my life so much easier.” So, I’m not sure I can give an answer. But, I think you can get away with just learning the basics of MDX. Or learning the basics of both. Because, I think, that’s probably what you’re going to need. You probably think about, “What do I need to become an expert in?” I’m not sure what the answer is.

Mark V:

It’s kind of tough. That’s the position I’m in, personally. I’ve done a little MDX. I have a blog series and stuff like that; went really well. And I’m like, “Well, do I dive deeper into that? Do I do something similar for DAX?”

Kasper:

It kind of depends on the situation you’re in, I would think. If you have the opportunity to push Tabular, it fits much more into the Agile world. I mean, it’s so much easier to make some changes. But, if you’re customer demands are not Agile, if they want to stick to the old world methods, then Multidimensional is probably preferred, I would think.

Mark V:

So, having been on the [Analysis Services] team for a few years, are there features of Tabular, of Power Pivot, or anything that you championed and are really proud of? Anything where you’re like “Hey, I stood up for this, it’s in the product, and I’m really pumped?”

Kasper:

It’s so much of the little things. I have business, myself, with everything. Thinks like this particular DAX function; I need to make sure this works correctly. All the small things like Sort by other Column; making sure that came in.

Mark V:

I love that, by the way.

Kasper:

It’s so many of those little things that make the product complete.

Mark V:

I did a POC for a client using Tabular because it’s really a good fit and it was kind of a cool solution. One of the things I found when I was working on it was that, working within SQL Server Data Tools…. It’s not “awesome.” You can do it. You’ve seen some of my Tweets about changing Column names and things of that nature. There was a great tool that Cathy Dumas had written and put on Codeplex.

Kasper:

The DAX Editor one?

Mark V:

Yeah. The DAX Editor. Are there any thoughts to maybe upgrading that? Because, even though it was not fully compatible with [SSAS Tabular] Service Pack 1, and it had “issues,” it was awesome enough, that I used it anyway.

Kasper:

That was a personal prototype, together with someone else. I cannot speak for that person.

Mark V:

OK. But something like that. Writing DAX in THAT environment, even with it not working perfectly, was awesome.

Kasper:

I know. I get that. They found a quicker way to do it. Of course it was Codeplex, so it was not officially supported. But with SP1, a lot of things changed in the model, so it [DAX Editor] broke.

But, I totally get it. I really sincerely hope we can come up with a better example in the product. I’m not saying that we’re doing it right now, but definitely would love to do something like that. This is part of what I was saying about having larger models. In Excel, it’s a different view point. If you are in Excel, you work to solve “a” problem, and then you throw it away. In a Tabular model, as a BI Developer, you have a solve a problem for 40 people. So, you need to look at it from all different angles, and different viewpoints. So, it’s bigger and more complex. So, you need bigger and better tools, and not just the Measure Grid.

Kasper:

One of the other examples of teams working together, and we almost had this on the Keynote: did you know you could have Excel 2013 with Power View and query Hadoop, with no caching, with our existing products today? I mean, this is awesome; it’s teams working together again. Excel 2013 Power View connects to a Tabular model in Direct Query mode. The Tabular model in Direct Query mode connects to PDW [Parallel Data Warehouse]. That sends Polybase queries directly to Hadoop. And we worked with the PDW team to make sure the queries that we send are supported in Polybase. So that they understand the queries that we send. It’s not going to be as fast as putting into Vertipaq [xVelocity]. But, there’s no caching. I directly go from your Excel spreadsheet, in Power View, to data in Hadoop and you return it.

Mark V:

How long has this been supported?

Kasper:

This has been supported for quite some time. One of my colleagues is getting in line to write a blog post about it. He still hasn’t done it. This is one of those things where, before we say anything is “supported,” we have to test it. And that costs money, right? So, that take money away from a Power BI feature or anything like that. But, in this case, we thought, “OK. This is going to be so cool!” And you can imagine, PDW just started going down this path. But, I can imagine, this will become faster in the future. So, this is going to be awesome. 

Wrapping Up

I really liked hearing how teams within Microsoft are working together. Kasper has a great point regarding traditional Microsoft BI requiring you to purchase several different products. Power BI really tosses that model on its head. if Microsoft really wants to democratize BI and bring it to the masses, the simplification of the process is a key step.

I have to confess that I had never heard of Prodiance until Kasper mentioned it. That sounds like some cool functionality that I will want to play with.

It seems that when new technologies come out, there always has to be people that say that some other technology must be dying in consequence. When Power View came out, there were people that decided Report Builder would go away. When Tabular came out, people panicked that Multidimensional must be going away. the sky is always falling, isn’t it? When Kasper made his point about the work that went into having Multidimensional Cubes support Power View, it made a lot of sense. Why would Microsoft invest time and effort in such a difficult task just to sunset Multidimensional soon after? That would make no sense. Kasper was pretty clear: Multidimensional is going to be around a while. As will MDX.

I really like Kasper’s point about Tabular being more in line with the more in tune with the Agile development cycles of today. It is a lot easier to make iterative changes to Tabular than it is in Multidimensional. At the same time, his point about Tabular not having been around the block yet is a great one. There were cool aspects to my choice of Tabular for a client project last year. There were also a few surprises that I had to deal with. I look forward to getting strong expertise with it so that I am in a better position to work around difficulties and take better advantage of new features when they come out. I was heartened by the fact that Kasper saw where I was coming from with a better environment for DAX development. Hopefully, there is more support for that within the team.

Kasper’s example of using Tabular in Direct Query mode hitting PDW is a great example of the future I would like to work in. Taking disparate technologies and putting them together to make a cool solution is just a blast.

Thanks so much to Kasper de Jonge for taking time out of his busy schedule (I think he presented 4 sessions at Summit) to sit down with me. My final interview post, with Director of Program Management for Microsoft BI Kamal Hathi, should come next week.

Technical Article: Report Model (SMDL) Alternatives in SQL Server 2012

It is with tremendous joy that I announce the release of my very first Technical Article! Click the image below to get a copy of your very own.

image

When I first started in the SQL Server business with Digineer about 6.5 years ago, one of my earliest projects was implementing a SQL Server 2005 Report Model for a client. Lara Rubbelke (Blog|Twitter), who led Digineer’s Information Management (SQL Server) Team at the time, set me up with that project along with some top cover from the mighty Jason Strate (Blog|Twitter). With two great mentors like I was lucky enough to have, that project set the stage for my career in SQL Server. It was during that project that I came to firmly believe in empowering end users in a managed environment. In the next few years, I ended up working on several Report Models for clients and giving well attended Intro To Report Model presentations.

Upon discovering that SQL Server 2012 meant the beginning of the end for Report Models, I was concerned for the folks that had been investing in them since their release. I saw forum posts that expressed frustration at their demise since many organizations had come to rely on them. It was clear that there were some technologies available that were superior to Report Models that could make great replacements in different scenarios. I looked for a source that combined all that information into a single location to help ease the transition of Report Models to other alternatives in the Microsoft BI stack. Since I could not find one, I decided I should go ahead and make one. Behold!

I want to thank Lara and Jason for their mentorship at the beginning of my career and through today. I also want to thank my great Technical Reviewers for this article:

Jin Cho (LinkedIn) – Microsoft

Mike Donnelly (Blog|Twitter) – Digineer

Aaron Drinkwine – Digineer

Chris Fish (Twitter) – Digineer

I need to thank Digineer for their continued support and being an awesome place to call home.

SSAS 2012 Tabular CONNECT Digest – VOTE PLEASE

A while back, I had the opportunity to implement an SSAS 2012 Tabular Model for a client. While I am really excited about the technology itself, I did find some challenges with the development environment in SQL Server Data Tools (SSDT), the SQL 2012 successor to Business Intelligence Development Studio. This post is a quick list of a few suggestions for Microsoft that have been posted to Connect.

Allow Marking a Table as Date Table in Diagram View

This one is not that huge a deal, to be honest. But, it did eat up some time. Like a stereotypical “guy,” I wanted to try to figure it out on my own before asking for directions… As it turns out, currently in SSDT, you must be in the Grid View of your Tabular model to mark a table as a Date table. It seems strange to me that you cannot perform this action from Diagram View. It seems like a silly limitation to me since it is not very intuitive.

If you think this would be worthwhile to fix, please vote up this Suggestion.

Allow Changing Many Column Names At Once

Tabular models are meant for business user consumption. Thus, friendly column names are important. With SSAS Multidimensional, you can make many changes to your project and afterward deploy them all at once. With SSAS Tabular, you are always working with a live Tabular model residing in your workspace database. As you make a change, the model in the workspace database is updated. While this makes it easy for you to play with your model via Analyze in Excel functionality, it means that tedious changes like changing column names to be more friendly can be a total pain in the office.

If you would like SSDT to allow for changing multiple columns names at once and then making the model update AFTER all of those changes instead of each one, please vote up this Suggestion. Note, there is a workaround on that item that was provided by Microsoft Program Manager Kasper De Jonge (b|t).

Campaign For PowerPivot/Tabular Textual Modeling Language

This one comes from Marco Russo (b|t). I am at Tech Ed North America in New Orleans this week. After the excellent DAX PreCon given by Marco and Alberto Ferrari (b|t), I was chatting with them a bit about my own experiences with Tabular. Marco asked what I thought about trying to get a human-usable textual scripting language for Tabular. I was totally on board with that. Marco release this blog post to start this ball rolling. Marco makes some excellent points in this post, which I will not reiterate here. Please read that post.

If you agree that a textual DDL style language for Tabular would be way helpful, or you just want to build up great karma by helping out Tabular developers, please vote up this Suggestion Marco created.

This suggestion by Marco, in my opinion, is way more important than my suggestions related to the GUI of SSDT. A scripting language would be AWESOME here.

Who’s Got Two Thumbs And Is Speaking at the PASS Business Analytics Conference?

PASS_BAC_Logo_JPEGThat would be my friend, Doug Lane (b|t). Oh, and me, too. We are actually co-presenting a Star Trek themed session: Hailing Frequencies: Analysis Services Terms and Concepts.

Abstract:

In this Star Trek-themed presentation aimed at non-technical folks, we will explain the terms and concepts important to understand when participating in projects involving SQL Server Analysis Services (SSAS). You’ll learn the key differences between the SSAS Multidimensional Model (Cubes) and the SSAS Tabular Model. You’ll also learn the definitions and examples of key terms for each model, including but not limited to: measure groups, measures, dimensions, attributes, and hierarchies in the SSAS Multidimensional Model and tables, columns, and calculated measures in the SSAS Tabular Model. We will also demonstrate the basics of browsing of both Multidimensional and Tabular models using Excel 2013.

This conference has an amazing list of speakers.

image

The fact (no pun intended) that my name is among this group of fantastic presenters from Microsoft and the SQL Community is pretty overwhelming. And the fact that I get to share this opportunity with a friend I met at a SQL Saturday is just that much better.