First things first:
DISCLAIMER: No animals were harmed during the creation of this post.
Background
Power BI has long supported the ability to to use natural language queries against your data, a feature known as Q & A. You can read more about it here. There are steps you can take in building your data model that can result in an improved experience for users of Q & A against that model. You can read about Q & A and how it works in a great two-part series on the Power BI Team Blog:
Demystifying Power BI Q & A Part 1
Demystifying Power BI Q & A Part 2
One of the tactics for creating a better Q & A experience is to us Synonyms in your data model. Synonyms, as the reference to the grammatical construct suggest, are words of phrases you supply for Q & A to use as stand-ins for the names of tables or columns in the model. For example, if you have a table in your data model called Student, but some users use the term Learner instead, then you could add a synonym “Learner” to the Student table and make it easier for users who prefer Learner to use Q & A and get proper results from the Student table.
The example I use for this post is based on the Pig Data Analytics presentation I gave as part of the BI Power Hour at PASS Summit 2015. OMG THAT WAS SO FUN. At the time, the use of Synonyms was available in Power Pivot, but not in Power BI. That has since changed. I was reminded of this a few weeks ago when sharing this story with a customer.
Baby Toes!
 Here in the US, it is pretty common for people to say a little poem while playing with the toes of a baby. You start with the big toe and move down to the tiny, pinky toe with each line.
This little piggy went to market
This little piggy stayed home
This little piggy had roast beef
This little piggy had none
And THIS little piggy went wee wee wee all the way home.
On the last toe, it is customary to tickle up the baby’s legs and torso. The result, for anyone other than Edward Scissorhands, is typically delight and a laughing baby.
Note: I tried this recently on my 14-year-old daughter’s toes. She did not appreciate it like she did when she as little.
For this post, I created three Power BI Desktop files. All have the same data model, based on the Quarterly Pigs and Hogs Report from the US Department of Agriculture. Who DOESN’T keep up with that, right? I grabbed the zip version here and isolated just the Breeding, Market, and Total Inventory – States and United States: December 1, 2015 and 2016 chart.
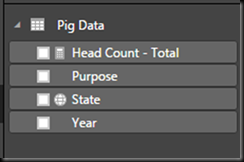
For all three files, the data model consists of one table, as shown in Figure 1.
Figure 1
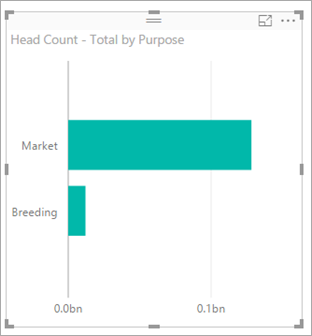
As you can see, there is a field called Purpose and a single measure called Head Count – Total. Each Power BI Desktop file includes a single visual, as shown in Figure 2.
Figure 2
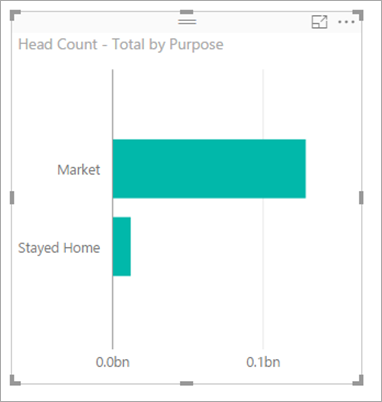
As you can see, far more pigs are sent to market than stay home. You can also see why this source data is perfect for this exercise. It shows the count of pigs going to market! While there is not a direct reference to “stayed home” in this data, it is presumed that those animals retained for Breeding did, in fact, stay home.
Note: There is a pork futures joke here, but my editor will not let me make it. Sorry.
No Synonyms Here
When I upload the Pig Data.dtsx file to Power BI and attempt to use Q & A to ask “How many little piggies went to market?”, I get the result shown in Figure 3.
Figure 3
Hm. That is suboptimal, but to be expected. Since there is nothing in my model called “little piggies” there is no way for Q & A to figure out what I am looking for.
Here’s a Synonym
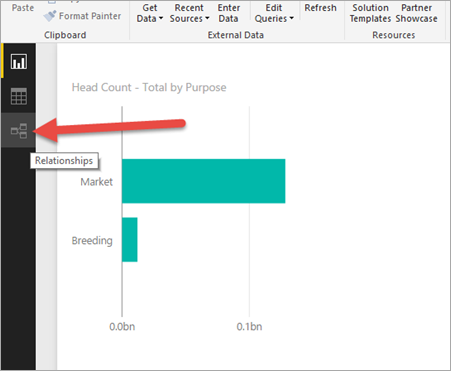
I created a second file, Pig Data With Synonym.dtsx. I then created a synonym by going into the Relationships view by clicking the icon on the left in Figure 4.
Figure 4
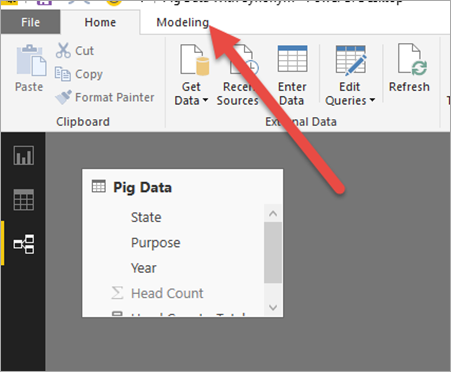
This switches to the Relationships View of the model. With this model having only one Table, there isn’t a lot to see here. However, once in this view, you can click on the Modeling tab at the top, as shown in Figure 5.
Figure 5
This will reveal the Synonyms button, as shown in Figure 6. Hazzah!
Figure 6
Note: The other views also have a Modeling tab. But the one on the Relationships View is the only one that features Synonyms.
After clicking on the Synonyms button, then select Pig Data as the table to work with, I now get the fancy options shown in Figure 7.
Figure 7
It’s a little faint, but you can see I added “little piggies” as a synonym for Head Count – Total. Thus, in Q & A, when I ask “how many little piggies” in the textbox, Power BI has a really good idea that I probably mean Head Count – Total.
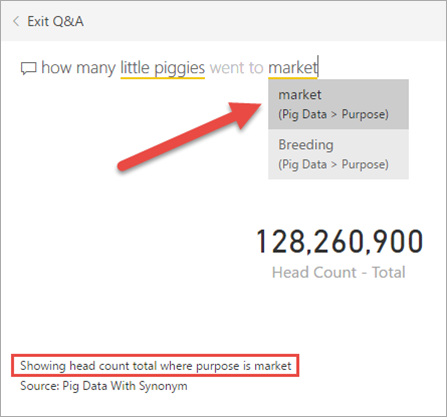
Thus, when I upload Pig Data With Synonym.dtsx to Power BI, and fire up Q & A, I get the delicious results in Figure 8.
Figure 8
Boom! It correctly interpreted little piggies with the Head Count – Total measure. AND, since I have a purpose whose value is “Market” I was able to filter the overall value for just the head count where purpose = Market. You can see that in the box at the bottom in Figure 8.
Now how much would you pay? But WAIT! There’s still more!
Bonus!
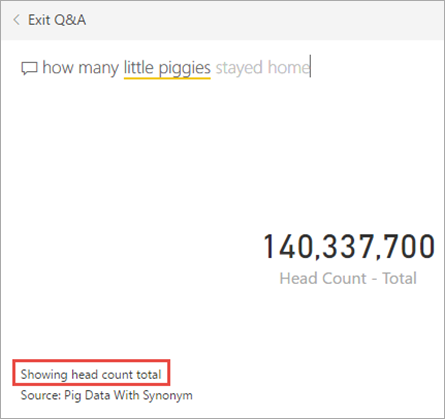
Suppose we ask our data model how many little piggies stayed home…
Figure 9
Hm. This didn’t work out quite as well. It was still able to determine that little piggies was referring to the Head Count – Total measure. But, since I don’t have “stayed home” as a value in any column in the model, it just showed the overall, unfiltered total count of all little piggies.
I decided to create a third Power BI Desktop file, Pig Data With Synonym Bonus.dtsx. With this one, while importing the data, I used the Replace Values feature of Power BI Desktop Query Editor to replace all instances of “Breeding” in the Purpose column with “Stayed Home” just like it shows in Figure 10.
Figure 10
So, now, the visual on the report, instead of show bars for Market and Breeding, shows bars for Market and Stayed Home, as in Figure 11.
Figure 11
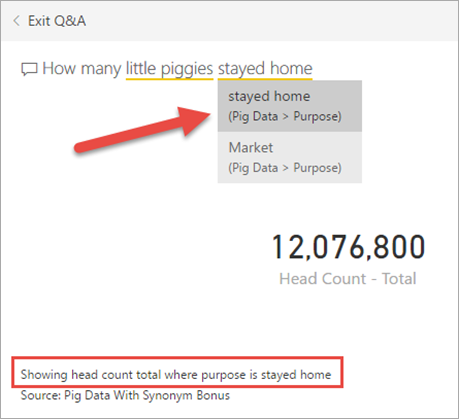
Thus, when I upload Pig Data With Synonym Bonus.dtsx to Power BI and use Q & A, I can get the fabulous results show in Figure 12.
Figure 12
There you have it. Synonyms can be a great way to enhance the experience for users of Power BI Q & A. However, since Synonyms are confined to the names of objects in the model, not values in the data, you will sometimes have to resort to more direct tactics to get what you want.
Hm. I wonder of my 9-year-old daughter would still like the little piggies poem… Gotta run.
Categories: Power BI




This is a great explanation of synonyms! Is there a way to “ignore” certain columns as available for the NQL to choose from when the user is typing? For example, I have several columns in the data which are not going to make sense to a user and I don’t want them being used for the NQL results. I wondered if entering a nonsensical value for these columns’ synonym would do the trick here?
LikeLike
HI, Tacy. Sorry for the delay in response. Just getting back on my fee after back issues. Thanks for the kind words. Glad you enjoyed it. To my knowledge, there is not a way to ignore particular columns from being enabled for Q&A. I recommend reaching out on community.powerbi.com and see if others have discussed this yet. If not, you can make that suggestion to the product team.
LikeLike