Power BI Weekly Update–Drill, Baby, Drill

In this week’s update to the Power BI service, Microsoft added the ability to drill down into hierarchies. You can read the announcement here. There are some other cool additions as well.

I thought I would take Drill for a spin and share my thoughts.

How to Use Drill

In my Free Power BI account (I have a Free one and a Pro one for testing, etc), I have a dataset related to students selling chocolate for a school fundraiser. I decided to be really cryptic and called it Chocolate Sales.

Figure 1 shows the empty palette.

Figure 1

image

To start, I’ll choose my visualization, the simple Column Chart, shown by the arrow in Figure 1. That leads to Figure 2.

Figure 2

image

Figure 2 shows the empty Column Chart. I’ll click the box for the Teacher field, shown by the arrow. This leads to Figure 3.

Figure 3

image

The Teacher column now occupies the Axis of the chart. The next step requires some accurate mouse-work. You may want to stretch out a little. You don’t want to pull something. I’ll wait.

<pause>

Cool. We want the drill path to lead from Teacher to Student Name First Last. So, when we click on a Teacher column in the chart, we want to drill to a column chart of the students in that class. To do that, we need to drag the Student Name First Last column into the Axis box UNDERNEATH the Teacher, as shown in Figure 4.

Figure 4

image

If done correctly, both Teacher and Student Name First Last will be in the Axis box, with Teacher on the top, as in Figure 5.

Figure 5

image

The order of the fields here is important.  The field at the top of the list in the Axis box will serve as the top level of the hierarchy, ie the top level of the drill path. Each other field below it will serve as a deeper level.

EDIT: I just played around with this more and putting the Student Name First Last ABOVE Teacher in the Axis resulted in the proper behavior anyway. So, perhaps there is some cardinality estimation behind the scenes to ensure proper behavior.

You can add more than one, but we’ll just use one to keep it simple. Our next order of business is to add a measure. For that, we can just choose Sales Amount – Total from the Chocolate Sales table, shown by the Blue arrow in Figure 5. The result is shown in Figure 6.

Figure 6

image

Here we have a fabulous Column Chart. Feel free to take a moment and soak it all in.

<Pause>

Life is good. OK. The default behavior when click on one of the columns is to filter this page of the report according to the value in that column. For example, if we click on Mr. Roboto’s column, it will cross-filter all other visualizations on the page to just Mr. Roboto’s class, as shown in Figure 7.

Figure 7

image

You can see in Figure 7 that the columns for the other Teacher values have become transparent, making Mr. Roboto stand out. Thank you very much, Mr. Roboto, for helping me demonstrate just what I needed to. Thank you. If we had other visualizations on this page, they would be filtered for just Mr. Roboto’s class.

In order to make the new Drill feature work, we have to change this default behavior to something new. First, we can click on Mr. Roboto’s column again to clear that cross-filtering. This takes us back to Figure 8.

Figure 8

image

Notice the shiny new icon in the upper right of the chart, shown by the Red arrow in Figure 8. This is the Drill Down button. This changes the mode of the visualization to Drill Down mode instead of the default Cross-Filtering mode. I made those modes up. They are not official names or anything, they just seem to fit with the behavior.

In the upper left of the figure, shown by the Blue arrow, is the Drill Down Level button. We will come to that shortly.

For now, I’ll click the Drill Down button in the upper right, resulting in Figure 9.

Figure 9

image

Notice the Drill Down button in the Red rectangle. It has reversed itself: instead of a dark arrow on a light background, it is a light arrow on a dark background. This is the subtle indicator that the Drill Down mode of the chart has been enabled. Now, if we click on the column for Mr. Roboto, we get the result in Figure 10.

Figure 10

image

Instead of cross-filtering, we have drilled down one level from Teacher to Student Name First Last, showing the Sales Amount – Total for each student in Mr. Roboto’s class. Hazzah! We can then click the Drill Up button, shown by the Red arrow in Figure 10 to go back up to the Teacher level, as in Figure 11.

Figure 11

image

Now, the Drill Down Level button is shown by the Red arrow. This one will take us down to the next level, but apply no filtering. So, instead of getting to the Student Name First Last level for a particular Teacher, we get all of the students, as shown in Figure 12.

Figure 12

image

As you can see, there is a horizontal scroll bar on the chart now, indicating there are too many values to display in the space provided. This is because this chart now holds all students from all four classes.

That sums up the explanation of how to use this new Drill feature. You can turn off the Drill mode, and return to the default Cross-Filtering mode, by clicking the Drill Down button again.

My Thoughts

I am glad this feature is there, for sure. The ability to drill up and down through hierarchical levels is a really important bit of functionality. I also acknowledge that this is just the first pass at it. The fact that the Power BI team is able to keep going with WEEKLY releases here is outstanding. I must confess that I like the way this works in Power View better, where Drill is not a mode for the visualization, but an ability you use by double-clicking instead of single-clicking. That way, you do not have to choose between cross-filtering and Drill. As it is currently, you get one of the other, but not both. I do like, however, the Drill Down Level that lets you go down a level without having to filter. That can be quite handy at times. It will be great, at some point, to be able to guide the Drill to a new report that you have designed for the purpose of being the next level of Drill. But that is getting more structured, for sure, maybe a bit too structured for the current Power BI vision.

I hope you will try this out yourself. Power BI is such an exciting offering from Microsoft. Take it for a spin. If you haven’t already, head over to PowerBI.com and get a FREE account.

Power BI and The Open Bar

Back in July, the mighty Adam Saxton (Blog|Twitter) blogged about there being a limit of 10 reports per Dataset in Power BI. On your attempt to create your 11th report, you would get an error. Adam did point out, though, that you could have many pages within a report. That helped. That post from Adam mentioned above is no longer there because… <pause for effect> that limit has been raised to 200! Hazzah! Bar

I saw some grumbling over the 10-report limit. Granted, 200 is still a limit, but I feel there should be a limit. Power BI, after all, is currently an offering with only two subscription levels: FREE and $10/month. SOME manner of limit only makes sense. And 200 is definitely more than 10. It’s true. I looked it up on the Internet.

When the initial limit of 10 was announced, I asked for info from Microsoft on the maximum number of pages a Report could handle so I could write up a post and help spread the word and make sure people knew they could still do quite a bit even within that limit. When I checked back on the answer recently, I was told (per my Non-Disclosure Agreement with Microsoft) of the impending announcement and the new limit. Grand. That post would not be necessary. Hazzah, again!

This got me thinking, though. I felt the limit of 10 was pretty low and limiting, but I liked the fact that there was a limit. What???? You WANT to be limited???? Yeah. To an extent, I think it is a good thing. Here is the way I see it.

Events I have been to often have bars where people can get liquid refreshments. I, personally, seldom drink alcohol. But the vast majority of my friends do. To them, whether there is an Open Bar or a Cash Bar makes a difference. With an Open Bar, all drinks are paid for by the event rather than drinkers having to pay for them as they get them. With a Cash Bar, the drinkers have to pay as they go. I have often heard it said that an Open Bar leads to a lot more waste as people put their drinks down and forget them and just go get another cuz, hey, it didn’t cost anything. With a Cash Bar, people tend to pay more attention to their drink since they have made an investment of their own. I have not dug around in the data on this, but it seems reasonable, so let’s go with it for now.

When it comes reporting, a lot of organizations I have seen view their reporting environment, like SQL Server Reporting Services, for example, as an Open Bar. There is not a hard limit on reports. So, when in doubt, make a new report. Hey, it doesn’t cost anything, right? Ug. It actually does. Between the dev time for that report, and the testing (sigh, PLEASE test your reports, k?), and then resources involved in maintaining that report and perhaps running it via a schedule and dealing with issues, etc, there is very definitely a cost. When there is a limit on a resource, organizations tend (not always) to think more strategically about that resource. So, if you have a limit on the number of Reports you can create, you will think more about when to create a NEW report and when use an existing one that already has 99% of what the users are looking for. I have worked for several clients in a serious report sprawl situation. They may have dozens of copies of the SAME REPORT with the only difference being a hard coded value referring to a particular customer. Someone needs to learn about Parameters. But, I digress.

Even with this limit being raised to 200 in Power BI, my hope is that people take the few extra moments NOW to consider whether they REALLY need that new report, or if they can accomplish the same thing with what is already there. This hope applies to Enterprise reporting solutions (like SSRS) just as much, if not more than with Power BI.

Still, I have to hand it to Microsoft, here. It is a great example of customer feedback driving a change in a meaningful way. If you have feedback to offer around Power BI, please head over to http://community.powerbi.com/ and make your voice heard. Whether it be an idea for a feature or even just a question, the Power BI Community site is a great place to go.

My Full-Day Power BI Pre-Con for SQL Saturday 453 (Minnesota)

Greetings, friends! I am delighted to announce that I will be providing a full day pre-con on Power BI as part of SQL Saturday #453 in Minnesota in October. Woohoo! As you might guess, I am really excited about Power BI. Been there, done that, got the t-shirt. It’s the old branding, but that’s fine for now. Hey, Microsoft, if you want to send me one with the new branding, I wear an XL. Thanks.

Embedded image permalink

You have a PowerBI.com account, right? Right? Get a FREE one here.

I love the way Microsoft has been enabling users with the self-service offerings over the past few years. With Power BI, they have not just created a new offering, they have established an ecosystem for growing the Data Culture in pretty much any organization. Below is the abstract for this pre-con that just barely scratches the surface of what is possible with this fantastic technology. With their plan to release updates to the PowerBI.com service on a weekly basis and Power BI Desktop on monthly basis, it will be even better come October. 🙂

Click, Click WOW: The Exciting World of Power BI

With Power BI, Microsoft makes working with data even easier… AGAIN. After years of enabling IT and Power Users, they have released a new set of capabilities that truly enables EVERYONE. The NEW Power BI includes a cloud service, PowerBI.com, as well as a FREE, standalone application that combines Power Query, Power Pivot, and Power View into a single environment completely independent of Excel called Power BI Desktop.


This Pre-Con will cover the entire Power BI user experience, from creating dashboards in the Service to using Power BI Desktop to create data models that help you get the answers you need.


Power BI Service

·         What is Power BI?

o   General offering overview

·         Datasets

o   Importing data from a number of sources, both on-premises and in the cloud

o   Scheduling data refresh

·         Reports

o   Visualization overview

o   Pinning Reports to a Dashboard

·         Dashboards

o   Putting it all together in Tiles

o   Using natural language search to create new Tiles

o   Sharing your Dashboard with others

·         Configuration

o   Setting up the Power BI Personal Gateway to access on-premises data

o   Managing Groups for sharing and collaboration


Power BI Desktop

·         Getting/Transforming Data (Power Query)

o   Importing data from a number of sources, both on-premises and in the cloud

o   Renaming, combining, splitting columns

o   Changing formatting like Capitalization and removing unwanted spaces

o   Creating new columns

o   Replacing invalid values

o   Brief introduction to the M language

·         Designing Your Data Model (Power Pivot)

o   Creating relationships between tables

o   Using DAX to bring your model to life

o   Modeling and DAX Best Practices

·         Visualizing Data (Power View)

o   Choosing from the vast array of visualizations

o   Configuring visualizations for color, formatting, etc

o   High-level data visualization best practices


Microsoft’s goal with Power BI has been, “Five minutes to WOW!” Imagine how many WOWs we can get in a full day pre-con!

General Availability of Power BI

As of this very night (actually, some on Tuesday and some tonight), the NEW Power BI released. As a Business Intelligence guy, and especially as one that believes strongly in hePowerBIAllTheThingslping people to help themselves, this release is a HUGE deal for me. Over the past few years I have become a huge fan of Power Query, Power Pivot, and Power View working in Excel. I barely got started with Power BI for Office 365. I was going to dig into it more when the news of the NEW Power BI came in and was follow by a preview. That clinched it for me.

I am ecstatic with the new direction of Power BI. While Power BI for Office 365 is still there for now, the future is definitely the new service at PowerBI.com and the associated applications and mobile apps. The decoupling of this great functionality from Office/Excel and from SQL Server just provides so much flexibility and plays beautifully into the Mobile First Cloud First push from CEO Satya Nadella. This new direction for Microsoft is just so exciting.

I strongly encourage you go head over to www.powerbi.com and sign up for a FREE (wait…FREE? yes FREE) account. Look for more content here in the future on Power BI. For now, I just want to share that it has arrived.

I do have to share something way fun. I think I may be the first person to actually tell a corporate vice president at Microsoft to go to bed on Twitter.

image

The response was fantastic, and about what I expected. 🙂

image

I just had to share that because it shows the passion that these folks have for what they do. We could go on about features that are not there and hem and haw, but at the end of the day, there are people working hard to provide a great experience. And I, for one, think they rocked it. To James Phillips, Jen Underwood, and so many more people who worked to make the new Power BI a reality, I say:

HeresToAJobWellDone

TARDIS – Time And Relative Distribution In SSIS

TARDISFans of Dr. Who will immediately recognize the title of this post. In that classic science fiction series, the Doctor has a very special vessel that lets him travel anywhere in Time and Space, even across dimensions. That vessel is called the T.A.R.D.I.S. (Time And Relative Dimension In Space). As I was crafting the idea for this post, paying homage to Dr. Who just seemed like the perfect hook.

At my current client, I have been working on an ETL solution. It involves automating the execution of about 70 unique stored procedures, each of which populate their own output table, written by another team and then consolidating all of that data into a dimensional model in a data warehouse. Many of these stored procedures do quite a bit of work and take several minutes to execute. Some run more quickly. Each of these procedures is independent of the others, so I am able to to run any of them in parallel with each other without affecting the results. This, will, however, affect server resources, so running all 70 at once would be a great way tick off the DBA. However, running them serially pretty much guarantees that I will exceed the 3 hour window in which my process must execute.

I decided to start by assigning each procedure to one of five processing silos, which I called Process Groups. I made these assignments in a table to allow for total control and tuning for best results. For example, if one of the procedures took far longer than the others, I could give that a Process Group all to itself and divide the others evenly across the remaining Process Groups. I actually created a procedure to automate that, but I will keep that for another post. For this post, I chose to just do three silos instead of five.

Note: I have included the SSIS solution as well as script that creates all necessary database objects and rows right here. I will only show code that directly impacts what I am trying to show here. Also, I am using SSIS 2014 for this post. At my client, I used SSIS 2012. While I am using a task that was introduced in SSIS 2012, namely the Expression Task, you can accomplish the same thing using a Script Task in prior versions of SSIS. So, I see no reason this could not work on 2008 R2 (and possibly earlier).

The TARDIS Child Package

I created a table called StoredProcedure with the following rows shown in Figure .

Figure 1

image_thumb1

The purpose of this table is to control the Process Group to which each stored procedure belongs. I also created each of those stored procedures. They each insert the Process Group value passed into them into their respective tables.

CREATE TABLE dbo.Table1 ( ProcessGroup tinyint , RecordCreateDate datetime2 DEFAULT CONVERT(datetime2,GetDate()) );

I created Table1 thru Table6 with this exact same pattern.

My child package is pretty simple, as shown in Figure 2.

Figure 2

image_thumb31

Figure 3 show the Variables in the package.

Figure 3

image_thumb5


The first step, marked with the 1 in Figure 2, is an Execute SQL Task that calls the GetStoredProcedureProcessGroup stored procedure which is shown below.

CREATE PROCEDURE dbo.GetStoredProcedureProcessGroup @ProcessGroup tinyint AS SELECT ProcedureName FROM dbo.StoredProcedure WHERE ProcessGroup = @ProcessGroup; GO

The task is configured to pass the value of the User::ProcessGroup variable as the @ProcessGroup parameter for the stored procedure, as shown in Figures 4 and 5.

Figure 4

image_thumb61

Figure 5

image_thumb7

Just to show how brilliantly this procedure works, let’s execute it.

EXEC dbo.GetStoredProcedureProcessGroup @ProcessGroup = 1

It produces the following results shown in Figure 6.

Figure 6

image_thumb

Hold your applause, please. Feel free to check this against Figure 1 to make sure these are the procedures configured for Process Group 1. We’ll wait.

We good? Cool.

When these results get returned to the package, they are stored in User::StoredProcedureList variable, which is of the System.Object data type.

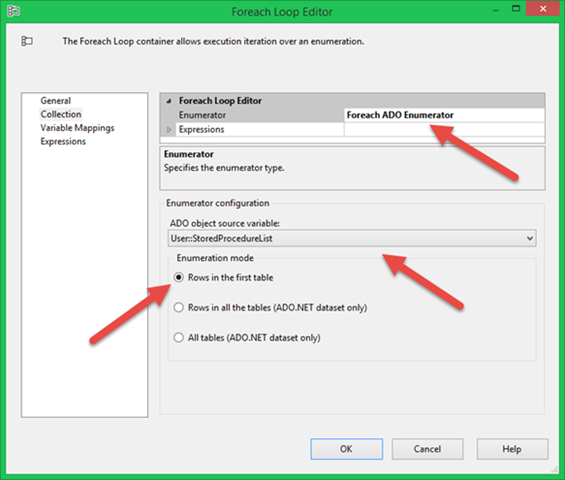
The next step in the package, marked with the 2 in Figure 2, is a For Each Loop that iterates through each row residing in the User::StoredProcedureList variable. That configuration is shown in Figures 7 and 8.

Figure 7
image_thumb4

Figure 8

image_thumb3

The first time through the loop, the User::StoredProcedure package variable will get the value ‘dbo.InsTable1’ which is the first row shown in Figure 6.

Package execution then moves on to the “SQL Execute Stored Procedure For Process Group” Execute SQL Task, shown by the 3 in Figure 2. This task calls the ExecuteSingleStoredProcedure stored procedure, which is shown below.

CREATE PROCEDURE dbo.ExecuteSingleStoredProcedure @StoredProcedure nvarchar(256) , @ProcessGroup tinyint AS DECLARE @SQLString nvarchar(1000) SET @SQLString = N'EXEC ' + @StoredProcedure + ' @ProcessGroup = ' + CONVERT(nchar(1),@ProcessGroup) + ';' EXEC SP_EXECUTESQL @SQLString ; GO

The configuration of the Execute SQL Task is shown in Figures 9 and 10.

Figure 9

image_thumb51

Figure 10

image_thumb6

The User::StoreProcedure variable was populated by the For Each Loop. The User::ProcessGroup variable will be passed from the Parent Package. For now, if we assume that value is 1, we end up with the following stored procedure call passing to the database:

EXECUTE dbo.ExecuteSingleStoredProcedure @StoredProcedure = N'dbo.InsTable1' , @ProcessGroup = 1;

This will insert a single row into dbo.Table1.

Once that execution is complete, the For Each Loop starts over again for the next row in the User::StoredProcedureList variable, the record for dbo.InsTable4, and the following stored procedure call pass to the database:

EXECUTE dbo.ExecuteSingleStoredProcedure @StoredProcedure = N'dbo.InsTable4' , @ProcessGroup = 1;

Once that exection is complete, the For Each Loop detects there are no more records in the User::StoredProcedureList variable, and it finishes its work, reporting Success.

To see the resulting effect on the tables, we can run the following query:

SELECT 'Table1' AS TableName, ProcessGroup, RecordCreateDate FROM dbo.Table1 UNION ALL SELECT 'Table2'AS TableName, ProcessGroup, RecordCreateDate FROM dbo.Table2 UNION ALL SELECT 'Table3'AS TableName, ProcessGroup, RecordCreateDate FROM dbo.Table3 UNION ALL SELECT 'Table4'AS TableName, ProcessGroup, RecordCreateDate FROM dbo.Table4 UNION ALL SELECT 'Table5'AS TableName, ProcessGroup, RecordCreateDate FROM dbo.Table5 UNION ALL SELECT 'Table6'AS TableName, ProcessGroup, RecordCreateDate FROM dbo.Table6 ORDER BY RecordCreateDate

This produces the results shown in Figure 11.

Figure 11

image

Since the stored procedures dbo.InsTable1 and dbo.InsTable4 were run serially, with dbo.InsTable1 going first, the RecordCreateDate for Table1 is earlier than that of Table4. Later, when we run all process groups, the RecordCreateDate will be the proof that the TARDIS solution works. The reason is that of the stored procedures, InsTable1 thru InsTable6, four of them have some manner of delay in their processing. For example, InsTable1 has the following definition:

CREATE PROCEDURE dbo.InsTable1 @ProcessGroup tinyint AS WAITFOR DELAY'00:00:20'; INSERT INTO dbo.Table1 (ProcessGroup) VALUES(@ProcessGroup); GO

Here I use the WAITFOR to cause execution to simply pause. In the case of InsTable1, I am pausing for 20 seconds. I took this approach just for this post in order to prove this solution works. InsTable1 will actually be the first procedure to get called. I put in the delay to make sure it finishes AFTER some procedures that are called later. With serial processing, this would be impossible. 

I mentioned that the TARDIS Child package would get the value of the User::ProcessGroup variable from the TARDIS Parent package. This is accomplished via a Parent Package Variable configuration, as shown in Figure 12.

Figure 12

image_thumb10

When the TARDIS Parent package tells the TARDIS Child package to execute, the TARDIS Child will look at the User::ProcessGroup variable on TARDIS Parent and take that value for its own User::ProcessGroup variable. The fact that the User::ProcessGroup variable of TARDIS Parent can only have a single value (at a time) meant I needed a way for each execution of TARDIS Child to get a different value. My solution ended up being pretty timey wimey.

The TARDIS Parent Package

This is where it gets really fun. First, I will just show you the TARDIS Parent package in Figure 13. Note that the numbers in Figure 13 denote the relative order in which I will discuss the tasks, not necessarily the order of execution.

Figure 13

image_thumb11

Step 1 merely involves truncating all of the output tables, Table1 thru Table6. Nothing to see here.

In Step 2, I use the Expression Task to set the value of the User::ProcessGroup variable to 1. The configuration of that task is shown in Figure 14.

Figure 14

image_thumb12

There isn’t really anything fancy about this. That said, I like the Expression Task. 🙂

Step 3 is the first Execute Package task calling TARDIS Child. Thanks to the Parent Package Variable configuration, TARDIS Child will get the value 1 for its User::ProcessGroup variable. The only setting I made here was in setting the connection manager to the TARDIS Child.dtsx file. That connection manager is shown in Figure 15.

Figure 15

image_thumb13

The Execute Package Tasks in Steps 3, 6, and 9 all use the same connection manager. Therefore, they all execute the same child package.

Step 4 is where the coolness comes in. When I originally started trying to solve this problem, I was attempting to come up with a way to have a single variable pass three different values to the child package. Then it hit me. There is NO reason I have to call the child package multiple times at EXACTLY the same moment. Like the TARDIS, it can exist in multiple dimensions, or time signatures, simultaneously. Therefore, all I really had to do was wait a bit, then change the value of the User::ProcessGroup variable before calling the next incarnation of the child package. Boom. This is accomplished using a Script Task. I got the code I needed for it from Mike Davis (Blog | Twitter) in this post on BIDN. The code for it is very simple, as shown in Figure 16.

Figure 16

image_thumb15

The Step A in the script adds the System.Threading to the references. This enables the use of the System.Threading.Thread.Sleep() method, which will essentially pause for the number of milliseconds provided. In this case, I am pausing 5000 milliseconds (5 seconds).

Once the wait is over, Step 5 of the TARDIS Parent package can change the value of the User::ProcessGroup variable to 2.

Step 6 then calls the TARDIS Child package a second time. But this time, then TARDIS Child gets a value of 2 for its User::ProcessGroup variable. As of that moment, TARDIS Child now essentially exists twice in Time and Space, just slightly offset.

Steps 7 thru 9 perform this same process, waiting 10 seconds instead of 5.

The wait is the key. What is also vital is that I do NOT have any precedence constraints between the separate calls of TARDIS Child. Thus, the second execution of TARDIS Child does not wait for the first. Nor does the third execution wait for the first or second. When the Sequence Container starts executing, the steps labeled 2, 4, and 7 all start at exactly the same time. This is shown in Figure 17, which took me several tries to capture properly.

Figure 17

image

The Tasks shown by the arrows all start at exactly the same time. Those waits in SCR Wait 5 Seconds and SCR Wait 10 Seconds cause my three executions of TARDIS Child to happen 5 seconds apart. Figure 18 was taken later in the execution.

Figure 18

image

Here you can see that, although the executions for Process Group 1 and Process Group 2 started before that of Process Group 3, the parallel nature of this solution meant that Process Group 3 could still finish first as it is independent of the other Process Groups. We can confirm this by querying the tables with the query we used earlier, ordering the results by RecordCreateDate.

SELECT 'Table1' AS TableName, ProcessGroup, RecordCreateDate FROM dbo.Table1 UNION ALL SELECT 'Table2'AS TableName, ProcessGroup, RecordCreateDate FROM dbo.Table2 UNION ALL SELECT 'Table3'AS TableName, ProcessGroup, RecordCreateDate FROM dbo.Table3 UNION ALL SELECT 'Table4'AS TableName, ProcessGroup, RecordCreateDate FROM dbo.Table4 UNION ALL SELECT 'Table5'AS TableName, ProcessGroup, RecordCreateDate FROM dbo.Table5 UNION ALL SELECT 'Table6'AS TableName, ProcessGroup, RecordCreateDate FROM dbo.Table6 ORDER BY RecordCreateDate

This returns the results shown in Figure 19.

Figure 19

image

Note the ProcessGroup column. This proves that, although the TARDIS Child package for Process Group 3 was executed last, it was able to finish first.

There you have it. I hope this can give you some ideas if you are ever in a similar situation. Bow ties are cool.

Power Query Free Training Webinar Follow-Up Questions

On April 7th, I gave my Power Query: Data Chemistry for the Masses presentation as part of Pragmatic Works Free Training on the T’s series. You can find the recording of that webinar here. I want to take a moment to thank the folks at Pragmatic Works for organizing and hosting this series that is such a great asset to the community.

At the end of the session, there were more questions than we had time to handle. So, they emailed me the questions in order for me to answer them in a post like this. Behold!

What is the maximum number of rows allowed in an Excel worksheet?

This question was likely in response to my recommendation of loading Power Query results to the Excel Data Model (Power Pivot) instead of to a worksheet. According to this info from Microsoft, the maximum row count in a worksheet is 1,048,576.

When combining files in a folder can the workbook have multiple tabs?

As far as combining files using the From Folder source, I have only succeeded with text files. However, there is a post here on the Dutch Data Dude blog that explains how to combine that source with a little custom M to make this happen.

When passing a parameter to an M function, can you select from a pick list of choices?

This question was in response to my converting a power query on Nobel Prize Laureates into a function that prompts for a prize category and then returns the Laureates for that category. Typically, instead of users interacting directly with the function, the parameter is passed to the function via a custom column. There is great post here on the Data Chix blog on how to do this.

Could we get a copy of the file being used in the demo?

You can get all of the materials for the presentation, including the files used, on the page for that presentation on this very blog.

Is the option to load to data model available for Excel 2010 or later versions?

I just learned over the weekend at SQL Saturday Madison that Excel 2010 does NOT have the option to load directly to the Data Model. Bummer. So, if you are using Excel 2010, you will need to load to a worksheet and then import to Power Pivot from that worksheet.

How do you know a web page is in JSON?

Well, web pages are not really in JSON. JSON is actually a “lightweight document interchange format.” I think of it more like a simpler XML. This question comes from my use of the Nobel Prize API to download Laureate data in the JSON format as part of this presentation. This is also detailed here as part of my Power Query Decathlon – Beginner blog series. The URL for consuming the API using JSON is http://api.nobelprize.org/v1/laureate.json. You can also do it as a CSV using http://api.nobelprize.org/v1/laureate.csv which will actively download a CSV file with all of the same data.

What do the different separators mean? [] i guess means column, but what is {} for?

I assume this question is related to the appearance of [] and {} in M query syntax. You can read about these in the Query Formula Language Specification document. This is a large resource and not recommended for “light” reading. 🙂 According to the specification, “We can use the lookup operator ([]) to access the fields of a record by name.” Also, the brackets [] can be used for referring to Records by surrounding the elements within the Record. the {} curly braces are used to referring to a List. A great, and easy to follow, resource is Chris Webb’s great book Power Query for Power BI and Excel. I am still very much a student of M, so I will not go much deeper into this at the moment.

Any plan from MS to add the ability to export the resulting data to a place other than XL, Data Model, eg text file, db?

I would LOVE the ability to use Power Query to load data into a database or a file, etc. Note that Power Query is used outside of Excel for loading data in the new Power BI preview as well as the Power BI Designer, which is also currently in preview. I have yet to see public information regarding any detailed plans for using Power Query to load to a larger number of targets. However, given the investment Microsoft is making in Power Query, it seems likely to me that we will see it popping up in more places in the future.

Could we use an Itunes folder as a source and consolidate music metadata?

Yup.

Here is the M code for a query I used to do just that:

let
    Source = Folder.Files("C:\Users\Mark\Music\iTunes\iTunes Media\Music"),
    #"Removed Other Columns" = Table.SelectColumns(Source,{"Name", "Folder Path"}),
    #"Replaced Value" = Table.ReplaceValue(#"Removed Other Columns","C:\Users\Mark\Music\iTunes\iTunes Media\Music\","",Replacer.ReplaceText,{"Folder Path"}),
    #"Split Column by Delimiter" = Table.SplitColumn(#"Replaced Value","Folder Path",Splitter.SplitTextByEachDelimiter({"\"}, null, false),{"Folder Path.1", "Folder Path.2"}),
    #"Changed Type" = Table.TransformColumnTypes(#"Split Column by Delimiter",{{"Folder Path.1", type text}, {"Folder Path.2", type text}}),
    #"Replaced Value1" = Table.ReplaceValue(#"Changed Type","\","",Replacer.ReplaceText,{"Folder Path.2"}),
    #"Split Column by Position" = Table.SplitColumn(#"Replaced Value1","Name",Splitter.SplitTextByPositions({0, 2}, false),{"Name.1", "Name.2"}),
    #"Changed Type1" = Table.TransformColumnTypes(#"Split Column by Position",{{"Name.1", Int64.Type}, {"Name.2", type text}}),
    #"Split Column by Delimiter1" = Table.SplitColumn(#"Changed Type1","Name.2",Splitter.SplitTextByEachDelimiter({"."}, null, false),{"Name.2.1", "Name.2.2"}),
    #"Changed Type2" = Table.TransformColumnTypes(#"Split Column by Delimiter1",{{"Name.2.1", type text}, {"Name.2.2", type text}}),
    #"Renamed Columns" = Table.RenameColumns(#"Changed Type2",{{"Name.1", "Track"}, {"Name.2.1", "Song"}, {"Name.2.2", "File Type"}, {"Folder Path.1", "Artist"}, {"Folder Path.2", "Album"}})
in
    #"Renamed Columns"

In the Code above, I highlighted the path to my Itunes folder. Just replace that with yours and past into a blank Power Query window. Here is the query once you have done so.

image

There is more data in the Itunes Music Library.xml file, but I haven’t figured out how to use it effectively yet.

Alright. That wraps up the questions. Thanks to all who tuned in to the webinar and provided such great questions.

2015 Microsoft Most Valuable Professional (MVP) for SQL Server

image

I am thrilled to announce that Microsoft has once again honored me with the MVP Award for SQL Server. Last year was my first award and I have to say that I was blown away by the brilliance and altruism of so many members of the MVP community. I attended my first Global MVP Summit this past November and the experience was even more amazing than I expected. I am so proud to be counted in this fine group of professionals.

Wow. Between starting a new job on Monday and getting renewed as an MVP on Wednesday, this is turning out to be quite the week.

New Adventures

I am excited to announce that, as of Monday, March 31st, I moving over to Tail Wind Technologies as a Business Intelligence Consultant. My eight years at Digineer have been a lot of fun. I learned a tremendous amount from my time here and will miss the fantastic people I have had the pleasure to work with.

My new role at Tail Wind will involve training up as a full on Data Architect. I will have a terrific mentor to work with and learn from. I had mentorship early in my career but have largely been driving my own development for several years. It will be great to get some more direct help on that front.

In addition to my consulting role at Tail Wind, I will be spinning up my own training company, focused largely around Excel BI/Power BI (at least to start with). Look for more info on that in the coming months.

These particular winds of change are fantastic for me. I owe a debt of gratitude to Digineer for helping me become the consultant I am today.

Advanced Column Splitting in Power Query

A friend of mine left a question on one of my Power Query Decathlon posts asking if it was possible to split a column using a carriage return as a delimiter. After a little poking around myself, I was not finding the answer I sought. So, I reached out for help. Curt Hagenlocher, a developer at Microsoft was kind enough to help me out. As it turns out, it appears that splitting a column based on carriage returns does not work. However, you CAN split columns based on the line feed character.

Note: M is actually informal name for the Power Query Formula Language.

The sample data

First, I created a collection of lines of text separated by using the <Enter> key. I did this in NotePad++, a free but powerful utility. I activated the feature which allows viewing of all non-printing characters. That is shown in Figure 1.

Figure 1

image

In Figure 1, you can clearly see the CR and LF characters after lines 1 and 2.

I then highlighted this block of text and pasted it into each of the cells in Field2 in the table in Excel shown in Figure 2. Not, I had to paste this into each cell using the formula bar, not into the cells directly.

Figure 2

image

The result is a very simple table where all of the values in Field2 contain <CR><LF> characters, hidden by default.

I then added a query with this table as its source by using the From Table button on the Power Query Ribbon. The result is the query shown in Figure 3.

Figure 3

image

This is our starting point for two different solutions.

M-less Solution

The first, and easiest solution starts with a simple Split Column transformation on the Field2 column. Figure 4 shows how to configure the Split Column for this example.

Figure 4

image

We start by creating a basic Split Column making sure of the following:

  1. Select whichever delimiter you want. However, it is best if you can find one that actually does not appear in the data.
  2. Make sure the “At each occurrence of the delimiter” option is selected. This is the default, anyway.
  3. Since there are a total of 3 lines of text in our Field2 domain of values, we need to set the “Number of columns to split into” option. You would think that the option indicating to split on each delimiter would mean this step would not be necessary. Unfortunately, as least as of the March 2015 update of Power Query, it is.

When you click OK, the result is shown in Figure 5.

Figure 5

image

Since there are no commas in this text, the result is a total of three columns, but only one of them has data. However, this is a necessary first step. The use of non-printing characters as delimiters is not supported by the Power Query UI. So, we need to manually edit the M for the Split Column by Delimiter step. Yes, I know I said this was M-less. However, the edit that is required is tiny and you are not really writing any M.

Figure 6 shows the unmodified M code for the Split Column by Delimiter step.

Figure 6

image

Notice the delimiter shown by the arrow. It is the comma since that is what we chose for this step initially. In order to change that to the <LF> character, we replace that comma with the #(lf) value as show in Figure 7.

Figure 7

image

The result of this change is shown in Figure 8.

Figure 8

image

Great, right? Awesome? Well, sort of. While this worked in our very simple situation in which we knew how many line of text were present, this was OK. And if that is your situation, then hazzah! However, reality is typically more complicated than that.

I saved this query as M-less in the Excel file provided with this post.

M-ful Solution

The more elegant and flexible solution requires M. And, I am still very much a student of M, and a beginner at that. The M code featured in this solution was provided by Microsoft’s Curt Hagenlocher, mentioned above, who was tremendously helpful in answering this question and very patient with my M noobness.

With this solution, the first step after the source is to change the data type of Field2 to Text. While I tried it without this step and it worked just fine on my simple sample data, it is not a bad precaution to ensure the Field2 column is text before proceeding. So, I left it in. The result is shown in Figure 9. Note that this is the last step in this solution that can be accomplished in the UI. It is all M from here.

Figure 9

image

There isn’t much to see here. But if you click on the View tab of the ribbon and then click on the Advanced Editor, you will see the M code for the entire query. That is shown in Figure 10.

Figure 10

image

The next step is to paste in the M provided by Curt. That code replaces the bottom section of the query, shown in the rectangle. Once the new code is pasted in, we will highlight a few parts. The final query is shown in Figure 11.

Figure 11

image

The entire query is pasted below to make it easy for you to copy. Note that, following the pattern of how M works, each step in the function, shown highlighted, has a name that is then referenced by subsequent steps.


let
    Source = Excel.CurrentWorkbook(){[Name="Table1"]}[Content],
    #"Changed Type" = Table.TransformColumnTypes(Source,{{"Field2", type text}}),
    SplitByDelimiter = (table, column, delimiter) =>
        let
            Count = List.Count(List.Select(Text.ToList(Table.Column(table, column){0}), each _ = delimiter)) + 1,
            Names = List.Transform(List.Numbers(1, Count), each column & "." & Text.From(_)),
            Types = List.Transform(Names, each {_, type text}),
            Split = Table.SplitColumn(table, column, Splitter.SplitTextByDelimiter(delimiter), Names),
            Typed = Table.TransformColumnTypes(Split, Types)
        in
            Typed,

    #"Split Column by Delimiter" = SplitByDelimiter(#"Changed Type","Field2","#(lf)")
in
    #"Split Column by Delimiter"


The steps in the function, as clearly as I can understand/explain them, are as follows:

Count = This step takes in the parameters for the table and the column and examines the contents in the column to discover how many times the delimiter passed in the parameter occurs in that column. This allows the function to dynamically create the correct number of columns instead of having to hard code it like we had to do in the M-less Solution.

Name = This step creates column names for as many columns as were determined in the Count step. The name for each column is prefaced with the original column name passed into the function.

Types = This step creates a list object containing all of the column names created by the Name step and appends to each the code necessary to converting them to text. This column will be used in a subsequent step to make it easy to convert all of the columns to text before exiting the function. This is cool. 🙂

Split = This step uses the Splitter.SplitTextByDelimiter function to perform the splits of the column into the columns provided in the Name step above using the specified delimiter.

Typed = This step uses the list of column names and the strings from the Types step to convert all of the newly created columns to Text. The results of this step are then returned from the function.

That completes the function walkthrough. Pretty neat, if you ask me.

The final step of the query is to invoke this function. This is done via the section of code in the red rectangle in Figure 11. For the table parameter of the function, this step uses the Changed Type query step we performed in the UI. This is a great example of how steps in queries, at least in M, are not limited to referencing only the single step that immediately preceded them.

The final result is shown in Figure 12.

Figure 12

image

This query was saved a M-ful in the working file provided.

NOTE: Neither of these solutions work for the <CR> character. So, replacing the #(lf) above for #(cr) does not produce the desired result. I even tried using #(cr)#(lf) and that does not work either. Just #(lf) worked for me.

There you have it. You can find the working file I used for this post right here.

One of the aspects I like best about blogging is the learning I get out of it. In order to try to explain things clearly in my posts, I need to study them and understand them. Through a previous post, I got a great question I had not thought about. Through the investigation, I found yet another great and helpful person within Microsoft in Curt Hagenlocher. In putting this post together, I obtained a far greater understanding of M and it capabilities than I had before.

Power Query Decathlon – Beginner 10: Query Management

NOTE: This post was created using the November 2014 version of Power Query. In later versions, some of the screens or functionality could be different.

You can download the Excel 2013 file necessary to perform the steps in this post here. To get to the existing query, click the Workbook Queries button on the Power Query ribbon.

For the final post in this series, we cover Query Management. There are several options available. We begin with our Workbook Queries pane.

1. Right-click the Laureate query to reveal the menu shown in Figure 1.

Figure 1

image

The query management options on this menu are as follows:

  • Edit – This allows you to open the query in the Query Editor
  • Delete – um…. this lets you delete the query. Note: If you delete the query, any tables loaded from this query will also be deleted.
  • Refresh – This will execute this query, loading fresh data to the configured Load destination. The Laureate query in Figure 1 is set to Loan nowhere, so the Refresh button is grayed out.
  • Load To – This option lets you change the destination to which this query loads.
  • Duplicate – This makes a full duplicate of this query including the source and all the steps.
  • Reference – This lets you make a new query that uses this query as its source.
  • Merge – This lets you create a new query that combines columns from this query with another.
  • Append – This lets you create a new query to adds the rows from a second query onto this one, rather like a UNION in T-SQL.
  • Send To Data Catalog – This allows you to save this query into the Power BI Data Catalog so you can share it with other Power BI users.
  • Move To Group – This lets you create folders within the Workbook Queries pane to organize your queries.
  • Move Up/Down – This lets you alter the position the query occupies in the Workbook Queries list.
  • Show the Peek – This allows you to bring up the Peek (preview) pane for this query.
  • Properties – This allows you to change the Name and/or Description for this query.

We will not cover all of these in this post. We will just do a few of them. The options we will cover are Reference, Merge, and Append.

Reference

To have one query use another query as its source, we use Reference.

2. From the menu in Figure 1, choose the Reference option, as shown in Figure 2.

Figure 2

image

This will create and execute a new query, using the selected query as its Source and using the default Load options. The result should resemble Figure 3.

Figure 3

image

The new query takes the name of the first query with an ordinal added. Figure 4 shows the Power Pivot table that was created as a result.

Figure 4

image

I just wanted to show this to make you aware that you may need to change names in your data model manually when you use this technique.

3. Double-click the Laureate (2) query to open it in the Query Editor, as shown in Figure 5.

Figure 5

image

You can see that the Source for the query is Laureate, not the Nobel Prize api that we originally used.

We will modify Laureate (2) to return only the Individuals (not organizations) that won prizes and name it accordingly.

4. Click the filter button in the Gender query header.

5. Click the Org option to deselect it, as shown in Figure 6.

Figure 6

image

6. Change the name of the query, in the PROPERTIES box to Individual Laureates, as shown in Figure 7.

Figure 7

image

7. Use Ctrl-Click to select both the Award Year and Award Category columns, as shown in
Figure 8.

Figure 8

image

8. Click the Group By button, shown by the arrow in Figure 8. This will launch the Group By dialog shown in Figure 9.

Figure 9

image

9. Click OK. The results should resemble Figure 10.

Figure 10

image

10. Click the Close & Load to save this query. This will save the changes to this query and execute it. The Workbook Queries pane should now resemble Figure 11.

Figure 11

image

We now have a summarized count of Individual Laureates by Award Year and Award Category.

Note: When I first started playing with Reference, I thought it would be a way to break a single source into multiple tables and minimize the impact on the source by only hitting that source once. My testing has shown me that that is not how it works. In the example above, executing (Refreshing) the Individual Laureates query will actually just include all the steps from the Laureate query when it runs. So, rather than execute the Laureate query and then use those results as a source, Power Query takes the steps from the Laureate query and includes them when executing any query Referencing the Laureate query. I tested this by creating a single query against a SQL Server table. I then created 4 other queries via the Reference method above. Tracing the SQL Server instance confirmed that the query was actually querying the source for each and every query, not just once. It seems to me, though, that there could be some advantage if you need to use the same source table multiple times and only want to build the steps to clean up that table once. So, in that sense, the Reference method could be a way to modularize your steps so you can maintain them in one place.

11. Create another Reference query based on Laureate. This will create Laureate (2) again.

12. Edit that query to return ONLY the Org values from the Gender column, as shown in Figure 12.

Figure 12

image

13. Give the query an appropriate name like Organization Laureates, as in Figure 13.

Figure 13

image

14. Use Ctrl-Click to select both the Award Year and Award Category columns, as shown in
Figure 14.

Figure 14

image

15. Click the Group By button, shown by the arrow in Figure 14. This will launch the Group By dialog shown in Figure 15.

Figure 15

image

16. Click OK. The results should resemble Figure 16.

Figure 16

image

17. Click the Close & Load to save this query. This will save the changes to this query and execute it. The Workbook Queries pane should now resemble Figure 17.

Figure 17

image

Note: When a Reference is made to a query by another, Laureate in this case, any changes to the referenced query can break the queries that reference it. So, in our example, making changes to Laureate could cause the other queries to become invalid. Just bear that in mind when deciding to use Reference.

Merge

Merge allows you to combine columns from one query into another, rather like joining tables together in a SQL query.

18. Right-click on the Individual Laureates query to reveal the menu shown in Figure 18.

Figure 18

image

19. Click the Merge option to launch the Merge dialog shown in Figure 19.

Figure 19

image

The query we chose, Individual Laureates, appears in the top section. This will be out main table. In the bottom section, we will choose the table from which to add columns to Individual Laureates.

20. Click the drop-down shown by the arrow in Figure 19. This will allow us to select the marge table, as shown in Figure 20.

Figure 20

image

21. Choose Organization Laureates. The dialog should now resemble Figure 21.

Figure 21

image

This is where we tell Power Query which columns to use for merging the tables so that rows in Individual Laureates can find matching rows in Organization Laureates.

22. Click the Award Year column heading under the Individual Laureates query, shown by the 1 in Figure 21.

23. Click the Award Year column heading under the Organization Laureates query, shown by the 2 in Figure 21. The dialog should now resemble Figure 22.

Figure 22

image

Note: It is not strictly necessary to always choose the column from the top query first. I just find it more intuitive. You can choose the Award Year column from Organization Laureates and THEN the one from Individual Laureates and this will still work just fine.

Once at least one join column has been specified for both queries, Power Query will indicate how many rows from the lookup query (Organization Laureates in this case) match rows in the main query. The highlighted message at the bottom of Figure 22 indicates that 110 or the 550 rows in Individual Laureates found matching rows in Organization Laureates when joining on Award Year.

For our merge example, we will join not just on Award Year, but on Award Category as well. I realize this is a pretty silly join since it will only match on rows where a specific award was shared by at least one Individual and an Organization. But, the mechanics of joining on more than one column are important.

24. Ctrl-Click the Award Category column heading under the Individual Laureates query, shown by the 1 in Figure 22. You must use Ctrl-Click so that Power Query knows that you are specifying an additional join column and not changing the join column selection you initially made.

25. Ctrl-Click the Award Category column heading under the Organization Laureates query, shown by the 2 in Figure 22. The dialog should now resemble Figure 23.

Figure 23

image

Here we can see both join columns selected in both queries. Since it is hard to see in Figure 23, Figure 24 shows a closer view of the column headings for the merge.

Figure 24

image

The 1 in the Award Year column header and the 2 in the Award Category column header indicate that we are joining first on Award Year and then on Award Category.

26. Click OK. The query should resemble Figure 25.

Figure 25

image

Our next step is to rename the Count column for the Individual Laureates query, shown by the arrow in Figure 25. The reason is that both queries contain a column named Count and and we cannot have duplicate columns names in a single query. Beside, Count is a pretty terrible name anyway. 🙂

27. Double-click the Count column header. It was pointed out to me in a comment on a previous post that I did not mention this method for renaming columns. Therefore, we shall use it here.

28. Give it a meaningful name like “Individual Count.” The query should now resemble Figure 26.

Figure 26

image

29. Click the Expand button, shown by the arrow in Figure 26. This will reveal the columns available from the Organization Query, as shown in Figure 27.

Figure 27

image

30. Change the selection so that only the Count column is selected, as in Figure 28.

Figure 28

image

Note the “Use original column name as prefix” checkbox. With this checked, the default, the new columns pulled from this query will be prefaced with “NewColumn” since that is the name of the merged column. I typically turn that off but will leave it on here in order to show what that looks like.

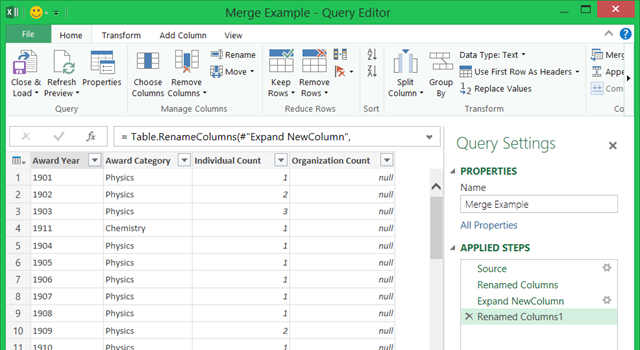
31. Click OK. The query should resemble Figure 29.

Figure 29

image

32. Rename the NewColumn.Count column to something more appropriate like “Organization Count.”

33. Change the name of the query in the PROPERTIES area to Merge Example. The query should not resemble Figure 30.

Figure 30

image

34. Close & Load. The Workbook Query pane should now resemble Figure 31.

Figure 31

image


Note: The Merge option is available when you editing an existing query. In that case, it will bring the new columns into THAT query instead of creating a brand new query that is the end result of the merging.

Append

The Append option allows you to basically stack all the rows from one query underneath the rows of another query. The result is a single query with all of the rows from both. It is important that the queries to be merged have the same structure.

35. Right-click the Individual Laureates query to bring up the menu shown in Figure 32.

Figure 32

image

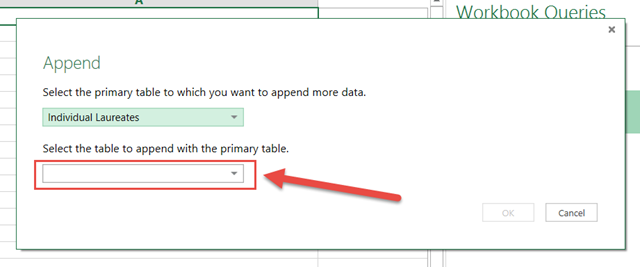
36. Choose Append, shown by the arrow in Figure 32. This will bring up the Append dialog shown in Figure 33.

Figure 33

image

37. Use the drop-down shown by the arrow in Figure 33 to select Organization Laureates as the one to append. The dialog should now resemble Figure 34.

Figure 34

image

38. Click OK. The query should resemble Figure 35.

Figure 35

image

39. Name the query Append Example.

40. Close & Load. The Workbook Queries pane should now resemble Figure 36.

Figure 36

image

The Append Example query has 573 rows (550 from Individual Laureates and 23 from Organization Laureates).

Note: You can use the Append option when you are editing an existing query. In that case, the rows from the second table will be appended to the rows in THAT query instead of creating a new query.

Conclusion

That brings this Power Query Decathlon – Beginner series to an end. I hope you found it helpful and that you see what an exciting tool Power Query is.