How I Use the Microsoft Business Applications Release Notes For Power BI Roadmap

Microsoft has been publishing and maintaining Release Notes documents to share our plans for Dynamics 365 and the Power Platform (Power BI, Power Apps, Microsoft Flow, and the Common Data Service for Apps). You can find them here: aka.ms/businessappsreleasenotes. This set of documentation is grouped to align with the semester system upon which development of the relevant offerings is based. The link above will automatically take you to the most recent edition of the release notes, which, at this time, is the April ‘19 Release Notes (covering the semester from April 2019 thru September 2019).

On the Power BI Customer Advisory Team (PBICAT), we see a lot of questions about the roadmap for Power BI and other related technologies. Often, the answers can be found in the Release Notes. While the layout of the Release Notes is somewhat intuitive, it can still be daunting for folks who are not used to them to find the information they need.

And so it came to pass that I decided to write a blog post on how I navigate the Release Notes, which I use daily in my role on PBICAT. I will be focusing on Power BI for this post, but the pattern is consistent across the other covered technologies. Behold.

What are Release Notes?

The Release Notes provide information on features that are planned for release during the relevant semester. The key word here is PLANNED. As the overview on the landing page indicates, “These release notes describe functionality that may not have been released yet. Delivery timelines and projected functionality may change or may not ship (see Microsoft policy).”

This is important. A feature appearing in the Release Notes with a particular release target date (sometimes just year and month) is not a 100% commitment. Sometimes, plans need to be adjusted.

The Release Notes Are a Living Document

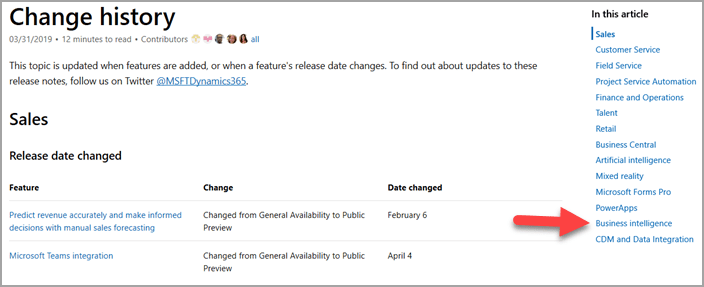
We update the Release Notes when our plans adjust. In order to make it easier to track what has changed, the left navigation pane of the Release Notes includes a page for Change History, as seen in Figure 1.

Figure 1

The Change History page will list modifications to the Release Notes that have occurred since the original publishing of the document for that semester. The right navigation pane, shown in Figure 2, lists the technology areas for which there have been changes, including a link to that list of changes.

Figure 2

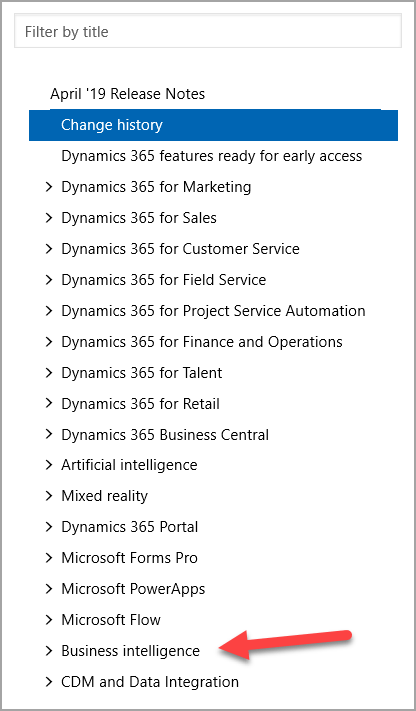
For Power BI, we will choose the Business Intelligence entry, shown by the arrow in Figure 2. This will list out the changes to the Release Notes with respect to Power BI Desktop, Power BI Service, etc, as shown in Figure 3.

Figure 3

This allows you to see exactly what change was made and the date the Release Notes were modified to reflect that change.

Since changes to this document can happen at any time, I personally always use the online version of the Release Notes rather than downloading the PDF. The PDF is not maintained with the same frequency of the online version. For example, in Figure 3 above, you can see changes for Power BI Desktop occurring on March 15 and March 18. At the time of this writing, the PDF of the April ‘19 Release Notes was last updated on March 29th. If you need to use the PDF from time to time for offline viewing, etc, just make sure to check back to the online version on a regular basis to see any changes that have occurred.

The Business Intelligence Section For Power BI

In the left navigation pane, which is visible regardless of where you are in the online Release Notes, there is an entry near the bottom for Business Intelligence, as seen in Figure 4. You will also notice that you can filter this list by title.

Figure 4

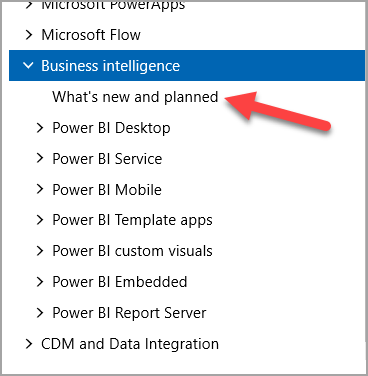
Clicking on Business Intelligence expands that section to reveal subsections for the different area of Power BI, as seen in Figure 5.

Figure 5

Typically, the first place I go is the What’s new and planned page, show with the arrow in Figure 5 above.

This wonderful page has the full listing of planned features, organized by the area of Power BI (corresponding to the sections in Figure 5). For each feature, you can find the type of release (General Availability, Public Preview) along with the target Date for that release, as you can see in Figure 6.

Figure 6

More often than not, the Date will just be a Month and Year. As the description at the top of this page indicates, that means that the release is planned to occur at some point within that month.

The What’s new and planned page is the only one (for each technology) that lists the target dates for the releases. Since “When is X supposed to come out?” is a very common question I get, starting in the What’s new and planned page will typically get me what I need.

Also, just like on the Change History page, there is a right navigation pane that allows you to skip to a particular area of the product, as shown in the circle in Figure 6.

Note: Remember that this is a living document. Thus, the dates shown in Figure 6 and elsewhere in this post are current as of the time of this writing, but could change at any time. So, make sure you use the real Release Notes for these dates and don’t rely on this post for that.

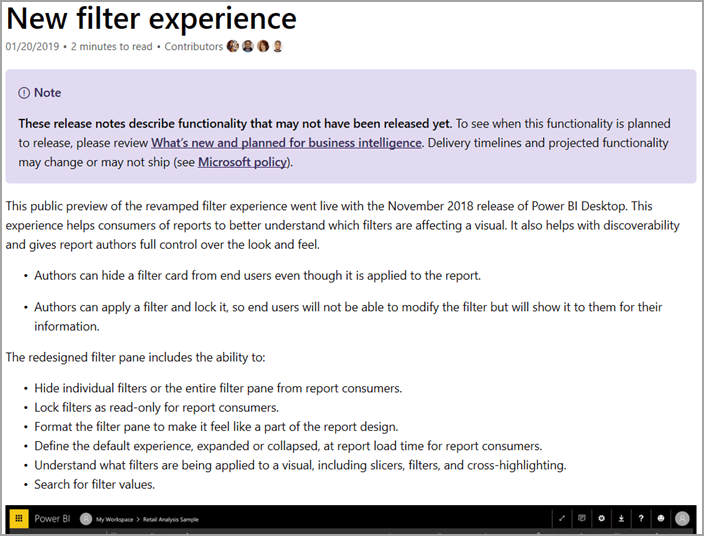
From here, you can click on a Feature to get more details around what is planned. For example, if we click on “New Filter Experience,” shown by the arrow in Figure 6, we go to the detail page for that feature, as shown in Figure 7.

Figure 7

The amount of detail in each Feature page will vary based on what the Feature owner has chosen/is able to share.

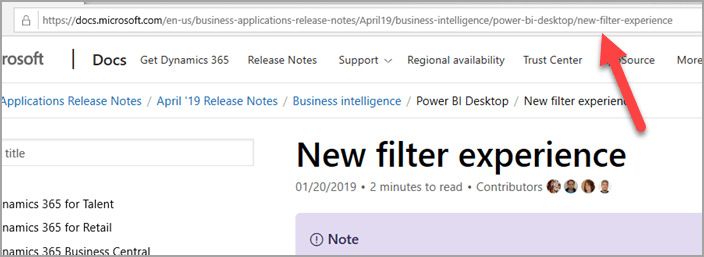
I also want to point out that each detail page has a link to take you directly to that page without having to navigate to it again from scratch. This is shown in Figure 8.

Figure 8

I think this is important because it allows you to easily share the details of a feature you are excited about with your colleagues, your boss, your mom, or whoever else.

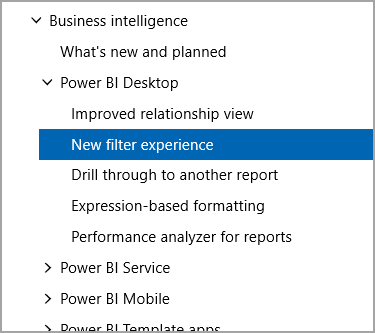
Also note that when navigating to the detail page for a feature, the left navigation pane expands to show you where that sits in the overall structure, as shown in Figure 9. You can, if you like, navigate to the detail pages this way instead of going through the What’s new and planned page. The path you take can vary based on what you need at the time.

Figure 9

What About Power Query and the Gateway and Connectors?

Connectors, Power Query, the On-Premises Data Gateway, etc are owned by the Data Integration team as opposed to the Power BI team. This is because they are not particular to Power BI, but rather to the Power Platform, etc, as a whole. Thus, the CDM and Data Integration section is where you will find the Release Notes entries for these and other features, as shown in Figure 10.

Figure 10

Wrapping Up

I hope this helps make navigating the Release Notes a bit easier. I know it is a big place with a lot of moving parts, so it can be a lot to take in when you are not used to it. But, once you have a better understanding of how things work, it becomes an easy and super valuable source for roadmap information.

Introduction to R Scripts in Power BI Desktop

Since I started learning R, I wanted to play a bit with the use of R scripts in Power BI Desktop. Note that my R skills are very basic, so please don’t use this post as an example of top-notch R.

At this time, there are three places in Power BI Desktop where you can use your own (or blatantly stolen from the Internet) R scripts. R can be an excellent option for adding prediction to your data models. For each, I will demonstrate how to do it as well as show the overall conceptual data flow. For Report View, I will show two examples since there are two conceptual data flows that are supported when using an R script in Report View.

1. Query Editor – Source

2. Query Editor – Transformation

3. Report View – Using Power BI Desktop Data Model

4. Report View – Bypassing Power BI Desktop Data Model

There will be some overlap between my content here and the official Microsoft documentation via the sites below. My hope is that this post can augment the well-done docs that exist already by adding my own thoughts on this.

Run R Scripts in Power BI Desktop

Using R in Query Editor

Create Power BI Visuals Using R

You can also use R-based custom visuals in Power BI Desktop. However, you use those like any other visual rather than supplying your own R script. Since the focus here is on using your own R script, I decided not to discuss R-based custom visuals in this post.

Note on the Format of This Post

As you no doubt follow my blog with rapt joy, you will know that I usually walk through step-by-step instructions with numbered lines of text like the following:

1. Do this thing. It should look like Figure A.

Figure A

2. Now do this other thing. It should look like Figure B.

Figure B

For this post, I decided to start using the numbered stamps available in SnagIt (I LOVE THIS TOOL) so that the images themselves will walk through the steps as much possible. To that end, as you read this post, I would love to get your feedback on how this works for you, dear reader. If you feel strongly, or don’t, I would appreciate your thoughts in the comments section below. Thanks.

Prerequisites

All of the options I will show require you to have R installed on your machine. I am using R version 3.4.3 I got here as well as R Studio (an IDE: Integrated Scripting Environment) version 1.1.383 I obtained here. You can also use Microsoft R Open, which you can get here. All are free. I am choosing base R and R Studio because I want to play with/show the use of non-Microsoft tools in conjunction with Microsoft tools. I am using 2.53.4954.481 64-bit (December 2017) of Power BI Desktop. Note that things could look/behave differently in other version of Power BI Desktop.

For this post, I am using a well-known dataset known as the Iris dataset, which you can read about here. I downloaded the zip file from here to obtain a csv file of the data set for one of my examples. The Iris dataset is also included in the “datasets” package in R Studio, which I will use as well.

Note: A key R concept to understand is that of a data frame, which is essentially just data in a tabular format. In a data frame, the “columns” are actually called “variables.”

Once you have R and an R IDE installed, Power BI Desktop will detect them. You can see this in the Power BI Desktop Options. You can follow numbered steps in Figures 1 and 2 below.

Figure 1

image

Figure 2

image

If you have multiple versions of R or multiple R IDEs installed, you can choose which ones you want Power BI Desktop to use via the drop-down menus shown in the red rectangles in Figure 2 above. You can also use this window to reach further documentation and change what location R custom visuals use for temporary data storage.

Query Editor – Source

When you use R as a Source, both the Import of the data and (optionally) and Transformations on that data are performed by R. This can be a great option when you have R scripts that already prepare data the way you want and you want to mix that with other sources in Power BI Desktop. It can also be a great option when you have R scripts that access data sources not directly supported by Power BI Desktop. Or maybe you just prefer R to the Query Editor experience. Whatever your reason, here’s how to do it.

Figure 3

image

Figure 4

image

This opens the window in Figure 5. Paste the R script here, then click OK.

Figure 5

image

The full R script for this is the following:

#import the datasets package to get the iris data
library(datasets)

#import the plyr package to use rename
library(plyr)

#import the stringr package to use str_to_title
library(stringr)

#import the iris data into a data frame called IrisSource
#and rename the variables using the rename function from plyr
IrisSource <- rename(iris
, replace = c(
"Sepal.Length"="Sepal Length"
, "Sepal.Width"="Sepal Width"
, "Petal.Length"="Petal Length"
, "Petal.Width"="Petal Width"
))

#set the Species values to title case
IrisSource$Species=str_to_title(IrisSource$Species,locale = "en")

This script imports the Iris dataset from the “datasets” package that comes with R Studio and uses functions from a few other packages to rename variables and change the case of the values in the Species variable. I chose to do this so that my R script actually performed some amount of transformation in addition to importing.

Figure 6 shows the preview of the IrisSource table. To use it, you can click the checkbox to select it and click Load.

Figure 6

image

Figure 7

image

Once it loads, you should see the IrisSource table in the FIELDS pane in Power BI Desktop. Now you can use it like any other table (create DAX Measures, relate it to other tables, or even perform additional transformations in Query Editor if you wish). In this particular example, I did everything in the R Script to show that you can.

Query Editor – Transform

You also have the ability to use an R script to transform data you already imported into Power BI Desktop. This can be a great option when you already have data in your model and you want to shape it with R. In this example, we’ll import the Iris dataset from a csv file using the native source in the Query Editor. Then, we’ll use an R script to Transform it. Follow these steps to get this done.

Figure 8

image

Browse to the file you want to import.

Figure 9

image

Figure 10

image

Once you have imported the file, and are in the Query Editor, your screen should resemble Figure 11.

Figure 11

image

Figure 12

image

Note the highlighted line at the top of the Script box in Figure 12. This is an indication that the data in the table has already been imported into a data frame called “dataset” for use in your R script. So, you need to reference “dataset” in your script to work with the data. The full script for this example is below. It performs the exact same transformations as in the example above, this time naming the resulting table IrisTransform instead of IrisSource.

#import the plyr package to use rename
library(plyr)

#import the stringr package to use str_to_title
library(stringr)

#import the iris data into a data frame called IrisSource
#and rename the variables using the rename function from plyr
IrisTransform <- rename(iris
, replace = c(
"Sepal.Length"="Sepal Length"
, "Sepal.Width"="Sepal Width"
, "Petal.Length"="Petal Length"
, "Petal.Width"="Petal Width"
))

#set the Species values to title case
IrisTransform$Species=str_to_title(IrisTransform$Species,locale = "en")

Figure 13

image

In the interest of data privacy, it is necessary to tell Power BI Desktop what level of privacy is required for each source in the file here.

Figure 14

image

This is where you indicate how private each data source should be considered. You can read more about privacy levels here. This is particularly important in cases where you could be mixing, for example, data from a sensitive database with reference data from a public source. Since, in some situations, the Query Editor will include data from one source when filtering another, this could mean that data from a public source gets sent as part of a query to that sensitive database. This could compromise the security of the private database. Note that you can also choose to ignore Privacy Levels for this file. If you are using data sources that you know and trust, you can disable the check in order to increase query performance. Please be careful when choosing this option so that you don’t inadvertently throw away privacy checks that really should be in place. Here, I will just set both sources as Organizational.

Figure 15

image

Note that in the Properties pane at the right, I changed the name of the final Query to be IrisTransform. Once you Close and Apply, you should see that IrisTransform has been added to the data model.

Figure 16

image

Once again, this new table can be treated like any other table in your model.

Report View – Using Power BI Desktop Data Model

In Power BI Desktop, you have the ability to create R visuals on data already imported into the model. In this example, we will use an R script to create an R visual on the data in the IrisTransformation table we created in the previous example. Here’s how.

Figure 17

image

In order to use script visuals in your file, you must Enable that feature.

Figure 18

image

Figure 19

image

In the context of the R visual, we need to add the fields we want to use in the visual to the Values field. It is important for this example that you select the fields in the order they are listed in Figure 19. This is because the R script I got from the matplot documentation uses positional references instead of actual variable names when referencing the variables. Since Sepal Length is the first variable in the Iris data frame, that column must be selected first. This matters here because Power BI Desktop automatically lists fields alphabetically in the FIELDS pane. Rather than “fix” it myself and make the script use names instead of variable ordinal position, I decided to leave it alone to show that this is something you may have to deal with. Personally, I would avoid using ordinals as issues like the above can crop up. TSQL, likewise, supports using column ordinals in, for example, the ORDER BY clause. I never use that. Despite the extra coding involved, in the interest of clarity, I always use column name references.

Note that you MUST select at least one field from the FIELDS pane before Power BI Desktop allows you to paste in your R script.

Figure 20

image

The fields from the table you add to the Visual go into the data frame called “dataset” and become available to the R script. Once you have pasted your script, you can click the Run Script button (step 5 above) to execute it. The full R script for this example is as follows.

iris <- dataset

table(iris$Species) # is data.frame with 'Species' factor
iS <- iris$Species == "Setosa"
iV <- iris$Species == "Versicolor"
op <- par(bg = "bisque")
matplot(c(1, 8), c(0, 4.5), type = "n", xlab = "Length", ylab = "Width",
main = "Petal and Sepal Dimensions in Iris Blossoms")
matpoints(iris[iS,c(1,3)], iris[iS,c(2,4)], pch = "sS", col = c(2,4))
matpoints(iris[iV,c(1,3)], iris[iV,c(2,4)], pch = "vV", col = c(2,4))
legend(1, 4, c(" Setosa Petals", " Setosa Sepals",
"Versicolor Petals", "Versicolor Sepals"),
pch = "sSvV", col = rep(c(2,4), 2))

The script above is a slightly modified version of an example from the documentation for matplot here. My modification was to import the “dataset” data frame into one called “iris” that is used throughout the script. That meant I didn’t have to change all the references in the script I got from the matplot documentation example. I should note that I do not fully understand how the script works yet. I chose it because it produces a very interesting visual that is very clearly NOT one natively produced by Power BI. The final visual is shown in Figure 21.

Figure 21

image

Note that Power BI Desktop lists the columns involved in the visual in the title bar, just as it does with native visuals. In this case, it lists out all of the columns from the IrisTransform table in the order I selected them.

Report View – Bypassing Power BI Desktop Data Model

With this method, the script use for the R visual references data outside of the Power BI Desktop data model.

Figure 22

image

Figure 23

image

We select one field in order to activate the R script pane in the R visual.

Figure 24

image

The full script is as follows.

table(iris$Species) # is data.frame with 'Species' factor
iS <- iris$Species == "Setosa"
iV <- iris$Species == "Versicolor"
op <- par(bg = "bisque")
matplot(c(1, 8), c(0, 4.5), type =  "n", xlab = "Length", ylab = "Width",
        main = "Petal and Sepal Dimensions in Iris Blossoms")
matpoints(iris[iS,c(1,3)], iris[iS,c(2,4)], pch = "sS", col = c(2,4))
matpoints(iris[iV,c(1,3)], iris[iV,c(2,4)], pch = "vV", col = c(2,4))
legend(1, 4, c("    Setosa Petals", "    Setosa Sepals",
               "Versicolor Petals", "Versicolor Sepals"),
       pch = "sSvV", col = rep(c(2,4), 2))


In this case, I completely ignore the “dataset” data frame provided by Power BI Desktop. Instead, I reference the iris dataset that R Studio already knows about.

Figure 25

image

As evidence I am not cheating, notice that my “dataset” data frame only includes the Species field from my data model. Yet the visual still properly plots the length and width just like my previous example. Also notice the title bar of the visual indicates the one field from IrisTransform I selected, but did not use.

There is one important thing to note when choosing whether to bother importing data into the Power BI Desktop data or just have the R visual take care of it. Visuals that do not reference data in the model will not participate in cross filtering and slicers. So, if we put the visuals from the two examples side by side and add a slicer, you will notices that the visual based on the IrisTransform table in the data model is filtered by the slicer, but the visual from our final example, bypassing the data model, is not.

Figure 26

image

Notice when Setosa is selected in the Species slicer, the Versicolor data points disappear in the left visual (using IrisTransform), but not the right(bypassing the Power BI Desktop data model).

Wrapping Up

Power BI Desktop is already a super flexible tool with the native functionality. The ability to extend that with R scripts just adds another layer of awesome. Hopefully, I showed that it is not very hard to use R scripts in Power BI Desktop. As I continue learning R, I hope to produce more posts that look even deeper at this great functionality.

Power BI Customer Advisory Team – Senior Program Manager

I am beyond ecstatic to announce that, as of January 1st, I will be moving to a new role as a Senior Program Manager on the Power BI Customer Advisory Team. This is a total dream job for me. I have been a huge fan of Power BI ever since it launched. And while I have enjoyed my time focusing on Azure and learned a lot, Power BI has always been where my heart is. This new role means I get to follow my heart AND work alongside the super talented Power BI product team that continues to crush it week after week and month after month.

Back in July of 2015, when Power BI became Generally Available, I blogged about it: General Availability of Power BI

The night Power BI went GA, via Twitter, I told James Phillips, the Corporate Vice President at Microsoft that owns Power BI, to go to bed. As of January 1, he will be my boss’s boss’s boss’s boss. That’s pretty cool, if you ask me. That night, I had never even considered that I would one day get to work for Microsoft and that I would have the opportunity to work on the extended Power BI product team.

To me, Power BI is an amazing example of Microsoft’s mission to enable every person and every organization to achieve more. It wonderfully fulfills the promise of bringing BI to the masses with an easy-to-use tool with terrific capabilities. I am so excited to officially make Power BI my mission.

Processing Azure Analysis Services Using Azure Automation

Recently, I was working with a customer who was deploying a Tabular model to Azure Analysis Services. They were wondering how they would automate the processing of that model. There are certainly a few ways to do that. You can do it with C# or JavaScript via Azure Functions, as is described in this post by Orsolya Gal. Since my background is not in C#, and the customer didn’t have that either, I decided to keep that option on a shelf for later.
 
I have done some PowerShell and I have worked with Azure Automation, so that seemed like a better place to start for me. Two posts in particular were helpful here:
 
Schedule Process Azure Analysis Services Database by the folks at microsoft-bitools.blogspot.com
 
Automation of Azure Analysis Services with Service Principals and PowerShell by Christian Wade, Senior Program Manager on the Analysis Services product team
 
My own solution ended up combining features from both of the above walk-throughs. My goal with this post is not only to walk through my own solution, but to also share, at each stage, why I made the choices I made. Note that I am still very much a student of PowerShell, so experts in that area will likely know of better ways to accomplish what I did. If you are a PowerShell guru and see where my scripts could be improved upon, I would love for you to share that in comments so I (and anyone else reading this) can learn. Mmmmm… learning…
 
Note: If you put all of this PowerShell into a single script file, you can declare each variable a single time and use it as many times as you need. For example, you will be entering a Password and storing it in a secure credential. You will need that in more than one place for this solution. If you have separate scripts for each location, you will have to enter that password more than once and increase the chance of having them not match, which will cause errors. I will proceed as though we are putting all of the PowerShell in a single script file to avoid having to repeat declarations and value assignments for PowerShell variables involved.
 

Creating Azure Active Directory Service Principal Using PowerShell

As Christian points out in his post above, Service Principals are essentially the Azure implementation of the Service Accounts we have on-premises. They allow applications and services to authenticate and access resources without manual intervention. While you can create service principals in the Azure Portal, I chose to go with PowerShell so that I could save the script and easily copy it for use again and again. In order for this to work, it is necessary to install the Azure PowerShell modules on the machine from which you want to run the scripts. In my case, it is my Surface Book. I, personally, use the Windows PowerShell ISE (Integrate Scripting Environment) that is native to Windows 10. Once you have that open, you can use the Login-AzureRmAccount cmdlet to log into Azure so you interact with the objects, etc, in the Azure subscriptions you have access to.
 
Once you log in, the output will include your Tenant ID. Capture that value for later.
 
image
 
From here, we will just assume you have done that.
 
$subscriptionID = "<your subscription ID GUID>"

$rootNameValue = "mvazureasdemo"

$servicePrincipalName = "$($rootNameValue)serviceprincipal"
$servicePrincipalPassword = Read-Host `
-Prompt "Enter Password to use for Service Principal" `
-AsSecureString

Write-Output "Selecting Azure Subscription..."
Select-AzureRmSubscription -Subscriptionid $subscriptionID

I started by creating a few variables and assigning them values. I will end up specifically selecting which azure subscription I want to work in. By specifying this, I can make sure I am creating and working with objects in the right place. To find your subscription ID, you can follow these steps in the Azure Portal.
 
I use the $rootNameValue as a prefix for all objects created as part of a solution. So, my server names, Azure Automation Assets (we’ll get to these in a bit), etc, all will start with this value. It helps me keep clear what goes with what. The $servicePrincipalName then derives its value by appended “serviceprincipal” onto the root name value.
 
The expression for the $servicePrincipalPassword will generate a box for me to securely enter in the password I want my Service Principal to have. This method allows me to make sure I don’t have something as sensitive as a password sitting in my code anywhere.
 
That last line above selects the subscription whose ID I put in the $subscriptionID variable.
 
# Get the list of service principals that have the value in 
# $servicePrincipalName as part of their names
$sp=Get-AzureRmADServicePrincipal `
-SearchString $servicePrincipalName

# Filter the list of just the ONE service principal with a DisplayName
# exactly matching $servicePrincipalName
$mysp = $sp | Where{$_.DisplayName -eq $servicePrincipalName}

# Isolate the ApplicationID of that service principal
$appSPN = $mysp.ApplicationId

This next section checks to see if a Service Principal already exists with the name I want to use. It is a little bit involved since I need to filter on a search string and not a specific name (the Get-AzureRmADServicePrincipal does not currently support filtering by DisplayName directly). So, I isolate all existing (if any) service principals that have my $servicePrincipalName value IN their names. For example, searching for “Foo” would return both “Fool” and “Foot.” Then I filter that list for the one that has a DisplayName property that matches my $servicePrincipalName value exactly. I then grab the ApplicationID property of THAT principal for use later.
 
# Create a service principal if it does not exist
Write-Output "Creating Service Principal $servicePrincipalName..."

try
{
If(!($appSPN))
{
New-AzureRmADServicePrincipal `
-DisplayName $servicePrincipalName `
-Password $servicePrincipalPassword

# Sleep for 20 seconds to make sure principal is propagated in Azure AD

Sleep 20

}
Else
{
Write-Output "Service Principal $servicePrincipalName already exists."
}
}
catch
{
Write-Error -Message $_.Exception
throw $_.Exception
}

In the code section above, I first check to see if my $appSPN variable has a value. If the Service Principal I want to create already exists, then its ApplicationID property value will be in that variable. If that variable is empty, I go ahead and create Service Principal using the value in my $servicePrincipalName variable for the DisplayName and the password in my $servicePrincipalPassword variable for the password. Service Principals can be created with certificates as well. I chose to use the password for now for simplicity. If the Service Principal already exists, I skip the creation and just return a message indicate it already exists. This means I can run my script multiple times without causing issues or generating errors from trying to create a object that already exists.
 
If the creation step DOES execute, my script waits 20 seconds to make sure that new Service Principal is alive and well in Azure Active Directory before taking my next action below.
 
# Assigning Service Principal $servicePrincipalName to Contributor role
Write-Output "Assigning Service Principal $servicePrincipalName to Contributor role..."

try
{
If(!(Get-AzureRmRoleAssignment `
-RoleDefinitionName Contributor `
-ServicePrincipalName $appSPN `
-ErrorAction SilentlyContinue))
{
New-AzureRmRoleAssignment `
-RoleDefinitionName Contributor `
-ServicePrincipalName $appSPN
}
Else
{
Write-Output "Service Principal $servicePrincipalName already `
assigned to Contributor role."

}
}
catch
{
Write-Error -Message $_.Exception
throw $_.Exception
}

 
In the section of code above, I check to see if my Service Principal has already been assigned to the Contributor role in my Azure Subscription. If so, I just return a message to that effect. If not, I add it. Notice again that this prevents my script from trying create something that already exists.
 
Once creation of the Service Principal completes, the output will provide you with the Application ID GUID value. Take note of that as we will need it shortly.
 
image
 

Assign Service Principal to Administrator Role on Azure Analysis Services Server

The newly created service principal needs to be added to the Administrators role on the server via the Security tab in Server Properties. This is to provide it with the necessary rights to perform Processing operations. To add the principal, use the account picker or do what I did, create the string in a text editor and paste it in:
 
app:<Application ID>@<Azure tenant ID>

image
 

Azure Automation Modules

If you don’t already have an Azure Automation account, you can follow the steps here to create one. PowerShell cmdlets are grouped together in Modules that share certain context. For example, Modules that are intended for management of SQL Servers are grouped together in the SqlServer module. Whether it be on your computer for use in the PowerShell ISE or in Azure Automation, the use of cmdlets is only possible when the Modules that contain those cmdlets are installed. You can read more about installing Modules here. For the purposes of processing Azure Analysis Services models with Azure Automation, it will be necessary to install the Azure.AnalysisServices and SqlServer modules in your Automation account. Note that each of those pages includes a Deploy to Azure Automation button.

Azure Automation Basics

Azure Automation allows you to execute scripts against your Azure environment. The components that perform the work, that contain the scripts, are called Runbooks. There are a few different scripting languages supported (including Python, which is now in Preview). For this process, we will use PowerShell Runbooks.

Often, Runbooks will have various parameters or values that are needed at runtime. For example, if you have a Runbook that boots up a virtual machine, you will need to tell it WHICH virtual machine to start, etc. These values can be passed into the Runbooks at runtime as Parameters, OR you can store these values in Assets like Variables and Credentials. For this process, we will be using one Variable Asset and one Credential Asset. Assets allow you to store values once but make those values available across all of your Runbooks, etc. Super cool.

Azure Automation Variable Asset

One value we will need to pass to our Runbook for processing out Analysis Services model is the Tenant ID of our Azure Subscription. This is a GUID that you are welcome to type/paste in every time you want to use it. Or you can hard-code it into your Runbooks that need it. But there is a far better way. You can store it in a Variable Asset. The instructions there show you how to create the variable via the Azure Portal. Since we are already doing PowerShell, let’s stick with it.

# Create function to create variable assets
function CreateVariableAsset
{

param
(
[string] $variableName
, [string] $variableValue
)

Write-Host "Creating Variable Asset $variableName..."

try{
If(!(Get-AzureRmAutomationVariable `
-AutomationAccountName $automationAccountName `
-ResourceGroupName $automationResourceGroup `
-Name $variableName `
-ErrorAction SilentlyContinue))
{
New-AzureRmAutomationVariable `
-AutomationAccountName $automationAccountName `
-ResourceGroupName $automationResourceGroup `
-Name $variableName `
-Value $variableValue `
-Encrypted $false `
-ErrorAction Stop

Write-Host "$variableName created successfully. `r`n"

}
Else
{
Write-Host "Variable Asset $variableName already exists. `r`n"
}
}
catch
{
Write-Error -Message $_.Exception
throw $_.Exception
}

}

The PowerShell above creates a Function that includes the necessary script to create an Azure Automation Variable Asset. Creating functions can be super helpful when you need to run the same block of code several times, with only minor changes to parameter values, etc. I created this function when building out a solution that involve a couple dozen Variables. Rather than repeat this block of code a couple dozen times, I created it once and then called it for each Variable I needed to create. This makes for much cleaner and easier to manage code.

$automationAccountName = "AutomationB"
$automationResourceGroup = "AutomationBRG"
$variableTenantIDName = "$($rootNameValue)tenantid"
$varaibleTenantIDValue = "<your Tenant ID GUID>"

First, we need a create a few more PowerShell variables. The first two specify the name and resource group of the Azure Automation account we are using. When creating Azure Automation components via PowerShell, you must specify which Automation account will house the objects, as you can have more than one Automation account.

The next two variables provide the Name and Value of our Variable Asset, respectively.

CreateVariableAsset `
-variableName $variableTenantIDName `
-variableValue $variableTenantIDValue

The block above calls our function to create the Variable Asset, if it does not already exist.

image

Hazzah!

Azure Automation Credential Asset

Since are going to automate use of a Service Principal with a password, we want to store that securely so that our Runbook can get to it without additional intervention. To do that, we use a Credential Asset. That link provides instructions on creating a Credential Asset via the Azure Portal.

# Create function to create credential assets
function CreateCredentialAsset
{

param
(
[string] $credentialName
, [PSCredential] $credentialValue
)

Write-Host "Creating Credential Asset $credentialName..."

try{
If(!(Get-AzureRmAutomationCredential `
-AutomationAccountName $automationAccountName `
-ResourceGroupName $automationResourceGroup `
-Name $credentialName `
-ErrorAction SilentlyContinue))
{
New-AzureRmAutomationCredential `
-AutomationAccountName $automationAccountName `
-ResourceGroupName $automationResourceGroup `
-Name $credentialName `
-Value $credentialValue `
-ErrorAction Stop

Write-Host "$credentialName created successfully. `r`n"

}
Else
{
Write-Host "Credential Asset $credentialName already exists. `r`n"
}
}
catch
{
Write-Error -Message $_.Exception
throw $_.Exception
}

}

I once again create a Function for the Asset creation.

$credentialServicePrincipalName = "$($rootNameValue)serviceprincipal"
$credentialServicePrincipalUserNameValue = "<your Application ID GUID>"

We need to create two more PowerShell variables; one for the Credential Asset name, another for the Credential Asset User Name value. We will need a Password but we already have that variable from when we created the Service Principal above. We can reuse that same variable so we don’t have to enter in a password again.

# Create a PSCredential object using the User Name and Password
$credentialServicePrincipalValue = `
New-Object System.Management.Automation.PSCredential`
(
$credentialServicePrincipalUserNameValue `
, $servicePrincipalPassword
)


# Call function to create credential assets
CreateCredentialAsset `
-credentialName $credentialServicePrincipalName `
-credentialValue $credentialServicePrincipalValue

We have to do one extra step here. We start by taking our User Name (Application ID) and Password and using them to create a PSCredential object. Then we call our function to create our Credential Asset.

image

More Hazzah!

Azure Automation Runbook

As I stated before, Runbooks contain the scripts that perform the work in Azure Automation. You can see how to create a Runbook in the Azure Portal. We will create out Runbook with PowerShell. However, we will not be using PowerShell to actually put the script inside the Runbook. You can do that with PowerShell by importing a saved .ps1 (in the case of a PowerShell runbook) that contains the PowerShell the Runbook will contain. I decided that was more complex than I wanted to get here. Besides, the steps after that take place in the Portal anyway. So, we will create the Runbook using PowerShell and then go to the Azure Portal to edit it and paste in our script.

$runbookName = "$($rootNameValue)processasdatabase"

We start by declaring a PowerShell variable to hold the name for our Runbook.

# Create empty Runbook
Write-Host "Creating Runbook $runbookName..."

try{
If(!(Get-AzureRmAutomationRunbook `
-AutomationAccountName $automationAccountName `
-ResourceGroupName $automationResourceGroup `
-Name $runbookName `
-ErrorAction SilentlyContinue))
{
New-AzureRmAutomationRunbook `
-AutomationAccountName $automationAccountName `
-ResourceGroupName $automationResourceGroup `
-Name $runbookName `
-Type PowerShell `
-ErrorAction Stop

Write-Host "Runbook $runbookName imported successfully. `r`n"

}
Else
{
Write-Host "Runbook $runbookName already exists. `r`n"
}
}
catch
{
Write-Error -Message $_.Exception
throw $_.Exception
}

Here we create the Runbook, using our shiny new $runbookName PowerShell variable along with a couple we declared previously.

image

Hazzah!

When to go to the Runbooks blade of our Automation account in the Azure Portal, we see our shiny new Runbook. It still has that new Runbook smell.

image

Clicking on the name of the Runbook will open the Runbook blade. Here we click the Edit button.

image

Then we past our PowerShell script into the window.

# Get the values stored in the Assets
$TenantId = Get-AutomationVariable -Name "mvazureasdemotenantid"
$Credential = Get-AutomationPSCredential -Name "mvazureasdemoserviceprincipal"

# Log in to Azure Analysis Services using the Azure AD Service Principal
Add-AzureAnalysisServicesAccount `
-Credential $Credential `
-ServicePrincipal `
-TenantId $TenantId `
-RolloutEnvironment "southcentralus.asazure.windows.net"

# Perform a Process Full on the Azure Analysis Services database
Invoke-ProcessASDatabase `
-Server "asazure://southcentralus.asazure.windows.net/mvazureasdemoserver" `
-DatabaseName "AzureASDemo" `
-RefreshType "Full"

Once we do, it should look like the figure below.

image

There are a few things to note here.

1. The names in the top section of the runbook must match the names you used when creating the Assets.

2. I am using the Add-AzureAnalysisServicesAccount cmdlet instead of the Login-AzureAsAccount cmdlet Christian used. I had trouble making that one work and more trouble trying to find documentation on it. So, I punted and used a different one. You can find documentation on the Add-AzureAnalysisServicesAccount cmdlet here. This is used to pass our Service Principal into the Azure Analysis Services server to connect to it.

3. Notice that my Azure Analysis Services server name matches my naming convention for this entire solution. Yeah. I know. I’m pretty cool. Yours does not have to match. Mine only does since I created it solely for this demo/post. This step performs the processing operation on the database. In this example, I am performing a Process Full on the entire database. You have many other options as well. You can find more information on the Invoke-ProcessASDatabase cmdlet here. On that page, the left sidebar includes other cmdlets related to processing Analysis Services objects.

When you have finished reveling in the awesomeness of this Runbook, click on the Test Pane button, shown by the arrow in the image above.

image

If our Runbook had actual parameters, they would show up in the Parameters section and we would be able to enter values for them. Since our Runbook is configured to just go grab what it needs from Assets, all we have to do is click Start.

image

Our Test run will go into queue to await its turn to run. Since we do not each have our own dedicated capacity in Azure Automation, each job needs to wait for a worker to pick it up to execute it. I have not seen the wait exceed ten seconds, personally. But not that starting a Runbook is not an instantaneous process. You can read more about Runbook execution in Azure Automation here.

image

Once a worker has picked it up, the status will change to Running.

image

Victory! Note that although this was a Test Run in the context of Azure Automation, this ACTUALLY PEROFMS THE ACTIONS in the Runbook. It does not “pretend” to call the Runbook. It executes it. In full.

You can check the status of the database via its Properties in SQL Server Management Studio.

image

The Last Data Refresh status should closely match the time you ran the Test Run.

Close the Test Pane via the X in the upper right-hand corner to return to the Edit pane.

image

Click Publish. This will fully operationalize your Runbook, replacing the version of the Runbook that exists if it was published previously. Once it is published, we can start it manually or give it a Schedule.

image

Note: If you just want to look at the contents of the Runbook, use the View button. Entering Edit mode on a Published Runbook will change its status to In Edit, and it will not execute. If you do enter Edit mode by accident, and don’t want to change anything, choose the Revert to Published button to exit Edit mode and return the Runbook to the Published state.

Click the Schedule button.

image

You can modify Parameter settings, etc, from the bottom option. In our case here, our Runbook has no parameters, so we can click to Link a schedule to our Runbook.

image

This will launch the Schedule blade. If you already have existing Schedules in your Automation Account, like “Every Monday at 6 AM” or something, those will show up here and you can choose to tack your Runbook execution onto one of those. I will just create a new one.

image

Give you schedule a meaningful name, ideally, one more meaningful than what I chose above. Note that you have to make sure the schedule is set to kick off at least 5 minutes into the future. Also, for this purpose, I am just choosing to have this execute Once.

Now we wait. Or, rather I wait, I guess. Anyway, back in a sec. Talk amongst yourselves. Here’s a topic: If Wile E Coyote could buy all that ACME stuff to try to catch the Roadrunner, why couldn’t he just buy some food?

And we’re back.

image

We can check the status of our scheduled Runbook execution by clicking on the Jobs button in the Runbook blade.

image

We can see it completed successfully. Hazzah! If we click on it, we can view more details.

image

The Job Status is Completed. There are not Errors or Warnings. We can click on the Output to see the actual job Output, just like in the Test Pane.

image

Hazzah!

image

And we can see in the Database properties that the Last Data Refresh matches the time of our scheduled Runbook execution.

Hazzah! Hazzah!

Wrapping Up

There you have it. We just automated the processing of an Azure Analysis Services database using an Azure Active Directory Service Principal, PowerShell, and Azure Automation. Although this post is a bit long, the actual steps to make this happen aren’t very difficult. Hopefully, this will help walk you through trying this yourself.

A Bully and a Hero: Depression and My Daughter

I typically blog about Microsoft data technologies, the overall Data community, and professional development topics. This is none of those. However, I think it will be the most important post I write.

Note: I post all of this with my daughter’s permission and assure you she has read it before I posted it. We agreed, together, that this story is too important to remain hidden. If we can help someone, anyone, by sharing this, then we’re going to do it.

My Goals for This Post

I have a few goals here. I want to lay them out at the beginning since the rest of the post will be organized according to these goals.

1. I wanted to provide a bit of insight on Depression for those that may not know much about it, or have only been exposed to common myths about it. As someone who has battled Depression, I hope I may be able to help a bit here.

2. I wanted to tell Paige’s story in the hopes that it might help someone else and even help chip away a little more at the stigma still associated with mental health issues, particular here in the US.

3. I wanted to provide a bit of insight for parents of depressed children. My hope is to have someone else benefit from my experience.

A Non-Clinical Primer on Depression

I have often seen/heard Depression described as being really really sad, typically by people who have not experienced it. I can certainly see why this may be the case since crying is often a physical symptom associated with it. A lot of people seem to think there is a continuum of happiness/sadness that has outright euphoria on one end and depression on the other. The idea being that as you move further down the Sad end of the spectrum, you move into the realm of Depression. This is not correct. Not even close, I’m afraid. Depression does not even belong on that scale at all.

Depression is its own separate thing, not just a subway stop in the city of Sadness. Depression has nothing to do with Happiness or Sadness. Depression does not care what great things you may have going for you in your life. It doesn’t care how much money you have. It doesn’t care who you are at all. Depression is the Honey Badger of the human psyche. Note, you can watch a funny video about the Honey Badger here, but probably best to do it without kids in the room.

Depression is a bully that knows EVERYTHING about you. Depression is a bully that goes EVERYWHERE you go. There is nowhere you go that it cannot follow. This just compounds the feelings of despair and hopelessness that Depression fosters.

Paige’s Story

We learned about six weeks ago that our oldest daughter, Paige, had been suffering with Depression for about six months. She had called me from the hallway outside one of her classes. She was sobbing and had no idea why. Having experienced Depression myself, I had an idea that it may be involved, as I encountered the same situation several times.

I brought her home and we started with calling the Nurse Line from our insurance provider. It was on this call that I learned that Paige had been fighting this for some time and that this included thoughts of suicide or self-harm. The nurse was super supportive and helped us get an appointment for Paige that afternoon. That started her down the path of getting some help. The immediate outcome was for some medication as well as some therapy.

Paige started seeing a therapist to help her, particularly since she had trouble opening up to us (my wife and me) about it. The therapy was helping and Paige was feeling better. Things were going quite well. While at one of the therapy appointments, I took one of the cards for the National Suicide Prevention Lifeline that were laid around the room and asked Paige to put it in the case with her cell phone so she would have it with her.

signLast Friday evening, Paige came to me in tears, on a call with her cell phone, holding up that card. The Depression had almost won, pushing her very close to an action that is hard to think about. But Paige managed to stop and call the Lifeline instead. After joining her on the call, the counselor and I agreed that she clearly needed more help than she was currently getting and she needed it NOW. I took her to the Emergency Room where a young Harry Connick, Jr. (seriously, the resemblance was amazing) took great care of Paige. He was careful to involve Paige, still a minor, and us, her parents, in all decisions about her care. We all agreed that it was best for her to stay in the hospital for a bit to get deeper help with this more profound bout with the Bully.

Paige spent 5 days in a special unit of the hospital aimed at helping adolescents stabilize and learn coping skills for dealing with Depression, Anxiety, and related issues. The people there were amazing and Paige is in a much better state now. She came home Wednesday morning. There is still a long road ahead. Depression is not like a broken bone in that once it heals, you’re done. Paige will need to deal with this well into the future, but now that it is out in the open, and she has better tools to help her, we are very hopeful.

HeroesAs I was thinking about this post and her story, I realized something I had not fully processed before: Paige is my hero. The Bully of Depression she is facing is so much stronger and more devious than anything I have ever faced. And while I have had to deal with Depression myself, I never had to do it as a teenage girl in a society that stills sees and treats girls as “less than.” I am in awe of how strong Paige is and how maturely she is approaching this fight. The grace, strength, and dignity Paige is showing as she stands up to her Bully are an inspiration to me.

The image at the right is one of Paige’s birthday presents. She’s a fan of David Bowie and we got her this poster and framed it for her room. It seems so fitting now that she have a poster about being a hero when she is one.

To Parents

Paige kept her struggle from us for months. Even having experienced Depression myself, there was still no clear sign of what she was going through. As a parent, it is our responsibility to keep our children safe and healthy. It was very easy for me to fall into the trap of blaming myself for not seeing this earlier. Despite intellectually knowing that this is not my fault, it was incredibly hard to silence the voice in my head, especially the Bully of my own history with Depression, telling me that I had failed her. If you learn your child (or any loved on for that matter) is suffering with Depression, try to resist the urge to blame someone (including yourself) or something and, instead, put your energy into supporting them and working with their care team to get them the help they need. No amount of blame will help anyone.

Depression has no respect or adherence to logic you may try to impose on it. When letting my mother-in-law know what was going on, she was asking a lot of questions as she was honestly trying to understand, which was great. If the therapy and medication Paige was already taking where helping, how could Friday’s events have taken place? The best answer I could come up with was that there is still so much about how our brains work that we just don’t understand. And, once again, Depression doesn’t care. It won’t do what makes sense to us.

If you need to, reread the Non-Clinic Primer on Depression above. Read up on Depression from respected sources in the fields of Psychology and Psychiatry, the more recent, the better. Put effort into understanding it rather than relying on what seems to be “common knowledge” about Depression from decades past. Your child/loved one is worth the effort and needs you.

Try to remain flexible about options for care that may come up. Knowing someone who has dealt with Depression and did X to overcome it does not mean that X is the answer for your child/loved one today. It is vital to openly consider the options presented by the care team instead of pinning everything on the one tactic you think should work.

Wrapping Up

If you or someone you know is struggling with Depression, know that there is help out there. It can be as simple as talking to your primary care provider or even just a phone call to the Nurse/medical advice line. Although it can be hard to reach out for help, it is worth it. You/your child/your loved one are worth it.

Pig Data Analytics: Enhancing Power BI Q & A Using Synonyms

First things first:

DISCLAIMER: No animals were harmed during the creation of this post.

Background

Power BI has long supported the ability to to use natural language queries against your data, a feature known as Q & A. You can read more about it here. There are steps you can take in building your data model that can result in an improved experience for users of Q & A against that model. You can read about Q & A and how it works in a great two-part series on the Power BI Team Blog:

Demystifying Power BI Q & A Part 1

Demystifying Power BI Q & A Part 2

One of the tactics for creating a better Q & A experience is to us Synonyms in your data model. Synonyms, as the reference to the grammatical construct suggest, are words of phrases you supply for Q & A to use as stand-ins for the names of tables or columns in the model. For example, if you have a table in your data model called Student, but some users use the term Learner instead, then you could add a synonym “Learner” to the Student table and make it easier for users who prefer Learner to use Q & A and get proper results from the Student table.

The example I use for this post is based on the Pig Data Analytics presentation I gave as part of the BI Power Hour at PASS Summit 2015. OMG THAT WAS SO FUN. At the time, the use of Synonyms was available in Power Pivot, but not in Power BI. That has since changed. I was reminded of this a few weeks ago when sharing this story with a customer.

Baby Toes!

imageHere in the US, it is pretty common for people to say a little poem while playing with the toes of a baby. You start with the big toe and move down to the tiny, pinky toe with each line.

This little piggy went to market
This little piggy stayed home
This little piggy had roast beef
This little piggy had none
And THIS little piggy went wee wee wee all the way home.

On the last toe, it is customary to tickle up the baby’s legs and torso. The result, for anyone other than Edward Scissorhands, is typically delight and a laughing baby.

Note: I tried this recently on my 14-year-old daughter’s toes. She did not appreciate it like she did when she as little.

For this post, I created three Power BI Desktop files. All have the same data model, based on the Quarterly Pigs and Hogs Report from the US Department of Agriculture. Who DOESN’T keep up with that, right? I grabbed the zip version here and isolated just the Breeding, Market, and Total Inventory – States and United States: December 1, 2015 and 2016 chart.

For all three files, the data model consists of one table, as shown in Figure 1.

Figure 1

image 

As you can see, there is a field called Purpose and a single measure called Head Count – Total. Each Power BI Desktop file includes a single visual, as shown in Figure 2.

Figure 2

image

As you can see, far more pigs are sent to market than stay home. You can also see why this source data is perfect for this exercise. It shows the count of pigs going to market! While there is not a direct reference to “stayed home” in this data, it is presumed that those animals retained for Breeding did, in fact, stay home.

Note: There is a pork futures joke here, but my editor will not let me make it. Sorry.

No Synonyms Here

When I upload the Pig Data.dtsx file to Power BI and attempt to use Q & A to ask “How many little piggies went to market?”, I get the result shown in Figure 3.

Figure 3

image

Hm. That is suboptimal, but to be expected. Since there is nothing in my model called “little piggies” there is no way for Q & A to figure out what I am looking for.

Here’s a Synonym

I created a second file, Pig Data With Synonym.dtsx. I then created a synonym by going into the Relationships view by clicking the icon on the left in Figure 4.

Figure 4

image

This switches to the Relationships View of the model. With this model having only one Table, there isn’t a lot to see here. However, once in this view, you can click on the Modeling tab at the top, as shown in Figure 5.

Figure 5

image

This will reveal the Synonyms button, as shown in Figure 6. Hazzah!

Figure 6

image

Note: The other views also have a Modeling tab. But the one on the Relationships View is the only one that features Synonyms.

After clicking on the Synonyms button, then select Pig Data as the table to work with, I now get the fancy options shown in Figure 7.

Figure 7

image

It’s a little faint, but you can see I added “little piggies” as a synonym for Head Count – Total. Thus, in Q & A, when I ask “how many little piggies” in the textbox, Power BI has a really good idea that I probably mean Head Count – Total.

Thus, when I upload Pig Data With Synonym.dtsx to Power BI, and fire up Q & A, I get the delicious results in Figure 8.

Figure 8

image 

Boom! It correctly interpreted little piggies with the Head Count – Total measure. AND, since I have a purpose whose value is “Market” I was able to filter the overall value for just the head count where purpose = Market. You can see that in the box at the bottom in Figure 8.

Now how much would you pay? But WAIT! There’s still more!

Bonus!

Suppose we ask our data model how many little piggies stayed home…

Figure 9

image

Hm. This didn’t work out quite as well. It was still able to determine that little piggies was referring to the Head Count – Total measure. But, since I don’t have “stayed home” as a value in any column in the model, it just showed the overall, unfiltered total count of all little piggies.

I decided to create a third Power BI Desktop file, Pig Data With Synonym Bonus.dtsx. With this one, while importing the data, I used the Replace Values feature of Power BI Desktop Query Editor to replace all instances of “Breeding” in the Purpose column with “Stayed Home” just like it shows in Figure 10.

Figure 10

image

So, now, the visual on the report, instead of show bars for Market and Breeding, shows bars for Market and Stayed Home, as in Figure 11.

Figure 11

image

Thus, when I upload Pig Data With Synonym Bonus.dtsx to Power BI and use Q & A, I can get the fabulous results show in Figure 12.

Figure 12

image

There you have it. Synonyms can be a great way to enhance the experience for users of Power BI Q & A. However, since Synonyms are confined to the names of objects in the model, not values in the data, you will sometimes have to resort to more direct tactics to get what you want.

Hm. I wonder of my 9-year-old daughter would still like the little piggies poem… Gotta run.

NEW Elastic Database Jobs: SQL Agent For Azure SQL Database

Azure SQL Database is part of a strong, and strengthening overall Data story in Microsoft Azure. The flexibility of the platform, the scalability, both up and out, and the fact that so much functionality is just included all combine to show Azure SQL Database as a great offering. One thing that has been missing that the on-prem (or Azure VM) world continues to enjoy is SQL Server Agent. SQL Agent has long been used for the scheduling and execution of database maintenance tasks relating to indexes, statistics, and on and on. You’ve certainly been able to perform tasks against Azure SQL using PowerShell, Azure Automation, etc. But that familiar ability to schedule the execution of plain old TSQL using plain old TSQL just wasn’t there.

Debra Dove, Principal Program Manager on the SQL Engineering team at Microsoft, announced at Ignite 2016 in September that a shiny NEW Elastic Database Jobs was entering Private Preview. Note that there is an earlier version of Elastic Database Jobs currently in public preview in the Azure Portal. This new version I am showing today will be the path going forward and will replace that current version in the portal. The NEW Elastic Jobs does not include a Portal experience at the time of this writing.

MemeThe new Elastic Database Jobs are designed to echo well the functionality the folks working with SQL Server are accustomed to on-prem with SQL Agent. But it’s even better than that. There are many features that are just baked in that you no longer have to worry about. I’ve presented on the new Elastic Jobs as part of a larger presentation on the overall Elastic tools associated with Azure SQL Database a handful of times. That presentation is called Azure SQL Database Elastic Boogie and references Marcia Griffith’s hit song Electric Boogie (The Electric Slide). Yeah. I know. That will explain the use of the word boogie all over the place.

Even with it just being a very new private preview, my experience has been a great one. Huge kudos to Debra and her team on that.

Note: There are several offerings around Azure SQL Database that include the word “Elastic” in their name: Elastic Database Pools, Elastic Database Query, the Elastic Scale Client .Net library, and Elastic Database Jobs. They all include “Elastic” in order to note how they help you with flexibility in a scaled out/up data tier in Azure SQL Database. You CAN use them all together; it often makes sense to do so. But none of them are requirements for the others. For example, your databases DO NOT need to be in Elastic Database Pools to take advantage of Elastic Database Query, the Elastic Scale Client, or the NEW Elastic Database Jobs.

If you would like to participate in the Private Preview, then feel free to skip down to the Requesting Private Preview Access section at the bottom. I will understand if you want to bypass the transcendent experience of my walkthrough… I guess…

Let’s dig in.

High Level Features of Elastic Database Jobs

1. Asynchronous execution of scripts

This is not meant for interactive querying. You can use Elastic Database Query (currently in public preview) for that. The scripts in your jobs will execute in the background against each target database.

2. Dynamic resolution of target databases

Elastic Database Jobs introduces a feature called a Target Group. When you create a job step, you specify the Target Group for which the job step should execute. Target groups can contain “include” or “exclude” references to Azure SQL Database Servers, Databases, and Elastic Database Pools. When using a Server or a Pool, the targets will be the Databases within those Servers or Pools. Since you can specifically create “exclude” entries in Target Groups, this lets you run your job against, for example, all databases on Server01 EXCEPT DatabaseA.

When the job runs, it starts by querying the entries in the Target Group in order to determine which databases should be targeted. It does this with every execution to make sure the list of targets is accurate at that moment. This is a fantastic feature. In the future, the team plans to allow you to target Resource Groups and Tags as well. I KNOW! RIGHT?! So cool.

Give or take certain special cases around data sovereignty (like Germany and China, for examples), you can execute jobs against databases in any Azure region using a single Elastic Jobs account.

3. Management using TSQL

Currently, during the private preview, you can only manage Jobs using TSQL. However, in the future, they plan to add ability to do so via REST APIs, PowerShell, and the Portal. REMINDER: The Elastic Database Jobs available in the Azure Portal at the time of this writing is the older version, not this new version.

4. Script execution guarantees

The Elastic Jobs engine guarantees “at least once” execution against all target databases. So, if a connection to a particular target databases fails, the engine itself includes configurable retry logic to keep making attempts to connect to that database to execute the job script.

The engine also guarantees that each job will only support one concurrent execution at a time. Suppose you have a job that typically executes in 30 seconds and you run that job every five minutes. If the execution of that job against DatabaseA is taking longer than expected and it still running when five minutes passes and the next execution should begin, the engine will skip DatabaseA and make note in the execution history that a previous execution is still running.

5. Reliable collection of query results to a single table (no duplicates)

You can execute a job that will query all the target databases and bring the results back to a single table for use in reporting, etc. Even if that job must retry against a particular database, it will ensure that no duplicates from multiple attempts are saved to the final destination table. Hereafter, I will refer to the database you use for this purpose as the Jobs Results DB. You can write to a database you use for other purposes as well. I just keep mine dedicated for organizational purposes.

This is a fantastic way to pull information from a scaled out data tier into a central repository for reporting and analytics scenarios.

A Quick Note About Scale

We have teams within Microsoft that rely on this technology to stay within strict reporting SLAs. Those teams have a large infrastructure they use with Azure to manage their business. The Elastic abilities within Azure SQL Database in general and Elastic Database Jobs in particular serve them well. We also have a customer using Elastic Database Jobs to manage a data tier of more than 130,000 Azure SQL Databases. This technology is HUGE for them.

Elastic Jobs Management Database

Once the private preview is activated for your Azure subscription (I will cover this at the end), you will execute some PowerShell to create an Azure SQL Database for the orchestration of Elastic Database Jobs. You can liken this to the role that the msdb system database plays in the on-prem SQL Server world.

This database must be an S2 (currently $75/month) or higher. So, if you want to play with this using Azure credits from an MSDN subscription, you will likely want to create this only when you will be working on it and destroy it when you are done. For the private preview, that is the only cost you really have. You pay for the database, and that’s it. I don’t have information to share on what the pricing will look like at general availability.

Note that you do not need to have the management database, which I will hereafter refer to as the Jobs DB, on a dedicated server. I just chose to do so in my own environment for organizational purposes.

In the Jobs DB you will notice some familiar stored procedures, as shown in my Jobs DB in Figure 1.

Figure 1

image

In Figure 1, you can see sp_add_job, sp_add_job_step, etc., just like in msdb. You use these stored procedures for creating and managing your jobs, job steps, etc.

This database also contains a view you can use for querying the history of job executions, aptly named job_executions. You can see this along with some other useful views in Figure 2.

Figure 2

image

Security Setup

For Elastic Jobs to work properly, there are some credentials, logins, and users that must be created.

First, in the context of the Job DB, you need to create a Database Master Key and two database scoped credentials.

 
-- Create a db master key using your own password. 
CREATE MASTER KEY ENCRYPTION BY PASSWORD='NOT 12345';
GO

-- Create a database scoped credential for job execution.
CREATE DATABASE SCOPED CREDENTIAL elasticjobcred
WITH IDENTITY = 'jobcred', SECRET = 'NOT 12345';
GO

-- Create a database scoped credential for the master database of servers.
CREATE DATABASE SCOPED CREDENTIAL elasticmastercred
WITH IDENTITY = 'mastercred', SECRET = 'NOT 12345';
GO

The jobcred credential will be used for executing the jobs on the targets databases. The mastercred credential is used to the dynamic determination of Target Groups members on target Servers (including the servers housing target Elastic Pools).
 
Next, in the context of the master data on each server that houses databases that will be targets (including the server housing the Jobs Results DB), you need to create a login for the jobcred and mastercred as well as a user mapped to the mastercred login.
 
/* EACH TARGET SERVER (including server to house Jobs Results DB */

/* master database */

CREATE LOGIN jobcred
WITH PASSWORD = 'same password used for jobcred secret';
GO

CREATE LOGIN mastercred
WITH PASSWORD = 'same password used for mastercred secret';
GO

CREATE USER mastercred
FOR LOGIN mastercred
WITH DEFAULT_SCHEMA = dbo;
GO

Then, on each database that will serve as a target, including the Jobs Results DB, create a jobcred user and add it to the role or roles appropriate for the tasks to be executed on that database.
 
/* each target database (including Jobs Results DB) */

CREATE USER jobcred
FOR LOGIN jobcred
WITH DEFAULT_SCHEMA = dbo;
GO

/* Add user to the database appropriate role(s) */
EXEC sp_addrolemember N'db_owner', N'jobcred';
GO
 
Note: I used db_owner merely for simplicity of my own demo environment. You can and should make sure the jobcred has only the rights necessary to perform the intended operations.

My Environment

I think it makes sense to quickly show the environment I use for this demo, which is shown in Figure 3.

Figure 3

image

My elasticjobsserver houses two databases: elasticjobsdb, which is my Jobs DB, and ElasticJobsResults, with is my Jobs Results DB, to which I save query results.
 
Boogieserver01 houses BoogieDB, and NoBoogieDB, both of which are empty.
 
Boogieserver01 houses BoogieDBIA, which contains data I fabricated about school children selling chocolate in Iowa. BoogieDBMN is the same for Minnesota and BoogieDBWI is for Wisconsin.
 
It is important for the walkthrough to note that I have databases on more than one server.
 

The Schema Update Walkthrough

Once the environment is ready to go, I need to create a Target Group. My group is called BoogieServerGroup.
 
-- Add a target group containing server(s)
EXEC jobs.sp_add_target_group 'BoogieServerGroup';

Then we need to add a member to this group, in this case boogieserver02.
 
-- Add a server target member
EXEC jobs.sp_add_target_group_member
'BoogieServerGroup'
, @target_type = 'SqlServer'
, @refresh_credential_name='elasticmastercred'
, @server_name='boogieserver02.database.windows.net';
 
You can see in the code above that the @target_type is SqlServer and I am specifying the mastercredential that will be used for querying the list of databases on that server when jobs using this Target Group execute. We can view the members of that target group via the jobs.target_group_members view.
 
-- View members of target group
SELECT
target_group_name
, membership_type
, target_type
, server_name
FROM jobs.target_group_members
WHERE target_group_name='BoogieServerGroup';

This leads to the results in Figure 4.
 
Figure 4
 
image
 
Notice that this is an Include member of the SqlServer target type. As noted earlier, you can create Exclude members as well. Those will be skipped when the Target Group is used for job execution.
 
Now, it’s time to create a job. This job will house a step to create a new table, dbo.ElectricSlide, in all target databases.
 
-- Add job for create table
EXEC jobs.sp_add_job @job_name='CreateTableElectricSlide'
, @description='Create Table ElectricSlide';

Then we need to create a job step for that job. At this time in the private preview, each job can have a maximum of one job step and that job step must be TSQL. Given that this step could be executed against databases multiple times, it is important that the query be idempotent.
 
-- Add job step for create table
EXEC jobs.sp_add_jobstep
@job_name='CreateTableElectricSlide'
, @command = N'IF NOT EXISTS (SELECT * FROM sys.tables
WHERE object_id = object_id('
'ElectricSlide''))
CREATE TABLE [dbo].[ElectricSlide]([ElectricSlideId] [int] NOT NULL);'

, @credential_name= 'elasticjobcred'
, @target_group_name='BoogieServerGroup'

We can view the job step definition.
 
-- View the job step definition
SELECT
[job_name]
, [step_id]
, [command_type]
, [command]
, [credential_name]
, [target_group_name]
FROM [jobs].[jobsteps]
WHERE job_name = 'CreateTableElectricSlide';

This produces the results in Figure 5.
 
image
 
A quick look at the Boogie databases on both servers shows none of them contain a table called dbo.ElectricSlide, as shown in Figure 6.
 
Figure 6
 
image
 
Let’s execute our job.
 
-- Execute the latest version of a job 
exec jobs.sp_start_job 'CreateTableElectricSlide'

Once our job is running, we can query the latest (in this case, currently running) execution of the job.
 
-- View latest execution
SELECT
is_active
, lifecycle
, last_message
, target_type
, target_group_name
, target_server_name
, target_database_name
FROM jobs.job_executions
WHERE job_name = 'CreateTableElectricSlide'
AND job_execution_id =
(
SELECT job_execution_id FROM jobs.job_executions
WHERE step_id IS NULL and create_time =
(
SELECT MAX(create_time)
FROM jobs.job_executions WHERE step_id IS NULL
)
)
ORDER BY start_time DESC;
GO

If we execute the above query immediately after starting the job, our results look like Figure 7.
 
Figure 7
 
image
 
Notice that the bottom row is WaitingForChildJobExecutions. In this case, the one child job running is the first row with the target_type of TargetGroup and the target_group_name of BoogieServerGroup. This is the child job that is querying the master database on boogieserver02, the only member of BoogieServerGroup, to find the databases on which to run the script in the job step.
 
After a few seconds, running that same query produces the results in Figure 8.
 
Figure 8
 
image
 
The list of databases has been determined and a child job execution has been created for each target database.
 
Once the job completes, the results of that query look like Figure 9.
 
Figure 9
 
image
 
In this case, all child job executions have succeeded, and therefore the overall job execution has succeeded.
 
If we look again at our 4 Boogie databases (3 on boogieserver02 and 1 on boogieserver01), we see what is in Figure 10.
 
Figure 10
 
image
 
All of the databases on boogieserver02 now have a dbo.ElectricSlide table. BoogieDB, since it is not on boogieserver02, does not.
 
Let’s add the BoogieDB database on boogieserver01, but only that database, to our BoogieServerGroup target group.
 
-- Add a database target member
EXEC jobs.sp_add_target_group_member
'BoogieServerGroup'
, @target_type = 'SqlDatabase'
, @server_name='boogieserver01.database.windows.net'
, @database_name='BoogieDB'
 
Once we execute this, we can query out BoogieServerGroup again to list it members.
 
--View the recently added database in target group
SELECT
target_group_name
, membership_type
, target_type
, server_name
, [database_name]
FROM jobs.target_group_members
WHERE target_group_name='BoogieServerGroup';

The results now look like Figure 11.
 
Figure 11
 
image
 
Notice we have two different target_type values, SqlServer for boogieserver02 and SqlDatabase for the row for the BoogieDB database member. This shows that the same target group can contain members of multiple types.
 
Let’s execute our job again.
 
-- Execute the latest version of a job 
exec jobs.sp_start_job 'CreateTableElectricSlide';
 
This time, I’ll just show the final results of the job execution. See Figure 12.
 
Figure 12
 
image
 
Notice that only the BoogieDB database from boogieserver01, not NoBoogieDB, is included. After all, how can you have an ElectricSlide if you have NoBoogie?
 
If we look at all of the Boogie databases again, we see that they all now have the dbo.ElectricSlide table, as shown in Figure 13.
 
Figure 13
 
image
 
As you can see, the new Elastic Database Jobs can be huge boon when managing a scaled out data tier.
 

Query Results Walkthrough

In this walkthrough, we will query all the databases in our target group and bring the results back to a single table in my Jobs Results DB, ElasticJobsResults.
 
We will use the BoogieServerGroup target group for this next phase as well. However, we will remove the BoogieDB target member since that is an empty database and therefore does not have the table that is the target of our query.
 
-- Remove a server target member
DECLARE @mytarget_id uniqueidentifier

SET @mytarget_id =
(
SELECT target_id FROM jobs.target_group_members
WHERE [database_name] = 'BoogieDB'
);

EXEC jobs.sp_delete_target_group_member
@target_group_name = 'BoogieServerGroup'
, @target_id = @mytarget_id;

Now, when we query the BoogieServerGroup, it should only have 1 member, boogieserver02, as shown in Figure 14.
 
Figure 14
 
image
 
Let’s create a job for collecting results from the data tier.
 
-- Add a job to collect results
EXEC jobs.sp_add_job
@job_name ='ResultsJob'
, @description='Collection data from all databases';

Now we can add a job step for collecting those results.
 
-- Add a job step to collect results
EXEC jobs.sp_add_jobstep
@job_name='ResultsJob',
@command= N'SELECT DB_NAME() AS DatabaseName, SchoolID, SchoolName FROM dbo.School;',
@credential_name='elasticjobcred',
@target_group_name='BoogieServerGroup',
@output_type='SqlDatabase',
@output_credential_name='elasticjobcred',
@output_server_name='elasticjobsserver.database.windows.net',
@output_database_name='ElasticJobsResults',
@output_schema_name='dbo',
@output_table_name='School';
 
You can see this job step uses more parameters than our table creation example above. This one specifies the server, database, schema, table into which the results of the query are to be stored. In this simple example, I am merely querying the dbo.School table in each target database. I will bring the results back to my ElasticJobsResults database into a table called dbo.School. Note that this will create the destination table if it does not already exist. This is a good thing since the query results include a field that I do not have in my query.
 
Let’s go ahead and execute this job.
 
-- Execute the latest version of a job 
exec jobs.sp_start_job 'ResultsJob';

Here is my job tracking query again, this time look at ResultsJob.
 
-- View latest execution
SELECT
is_active
, lifecycle
, last_message
, target_type
, target_group_name
, target_server_name
, target_database_name
FROM jobs.job_executions
WHERE job_name = 'ResultsJob'
AND job_execution_id =
(
SELECT job_execution_id FROM jobs.job_executions
WHERE step_id IS NULL and create_time =
(
SELECT MAX(create_time)
FROM jobs.job_executions WHERE step_id IS NULL
)
)
ORDER BY start_time DESC;
GO
 
The final results are shown in Figure 15.
 
Figure 15
image
 
Sweet. We now have a dbo.School table in the ElasticJobsResults database, as shown in Figure 16.
 
Figure 16
 
image
 
Let’s query it.
 
SELECT * FROM dbo.School;
 
The results are shown in Figure 17.
 
Figure 17
 
image
 
Note that the results include the internal_execution_id of the child job that retrieved each record. So, the Elastic Jobs engine is providing some ready-made lineage information for us. I also want to point out that the SchoolID in my dbo.School table in all of my Boogie databases is an identity column starting at 10000. Each one includes only a single record. Therefore, in each database, the single school present has a SchoolID of 10001.
 
This is a super simple example of querying an entire data tier with a single query using Elastic Database Jobs.
 
I hope you can see how exciting this is for the Azure SQL Database story. So far, the reception has been great. I demoed it for a customer the other day and the response was, “WOW! This is EXACTLY what we needed.” The Data story in Azure just keeps getting better and better.
 

Requesting Private Preview Access

Debra and her team are looking for participants for the Private Preview of the shiny new Elastic Database Jobs. If you would like to participate, and I would encourage you to do so, please email me using my Microsoft address, which is mark dot vaillancourt at microsoft dot com. Include a brief description of your role and your environment. I will connect you with Debra, who can get you started.

Passing Credential Asset in Azure Automation Test Pane

Lately, I have been learning Azure Automation. If you are not familiar with it, I encourage you to follow the link in the previous sentence. The remainder of this post will assume you have some familiarity with it.

Note: The solution presented here works today. As Azure Automation continues to evolve, there is no guarantee this will always be the answer.

Also Note: If you just want the answer, and would prefer to skip over my brilliant description of this epic journey contained in the Saga section, feel free to scroll down to the Out With It, Man! section at the bottom of this post.

Saga

Today, I was working on a Runbook to create a shiny new Azure SQL Database Server, as long as that server does not already exist. I have other Runbooks for creating the Server Firewall Rules and the Azure SQL Database itself. Keeping Runbooks small and very targeted is a recommended practice. Later, I will create another Runbook that calls each of the ones above to create the overall Azure SQL Database solution I am after.

One of my favorite features of Azure Automation is the ability to use Assets, which essentially allow you to store Variables, Credentials, and others pieces of information you can reuse across Runbooks. The key for this post is the Credential. This allows you to store a Username and Password pair that is stored encrypted for you in Azure. This allows you to have your Azure Automation Runbooks use this Credential to authenticate to some other service without embedding ANY part of the Username or Password in the Automation script itself. Boom. This is huge. It also allows you to utilize the Credential without having to know that Username or Password. I know, right?

To create this Azure SQL Database Server, my Runbook uses the New-AzureRmSqlServer PowerShell cmdlet. Rather than paste my entire Runbook here, I will just show the key pieces that are necessary for this post.

In accordance with recommended practices, my Runbook has a section at the top that lays out the parameters, shown in Figure 1.

Figure 1

param

(

      [Parameter(Mandatory=$True)] `

      [string] `

      $resourceGroupName

    , [Parameter(Mandatory=$True)] `

      [string] `

      $location    

    , [Parameter(Mandatory=$True)] `

      [string] `

      $serverName    

    , [Parameter(Mandatory=$True)] `

      [string] `

      $serverVersion    

    , [Parameter(Mandatory=$True)] `

      [PSCredential] `

      $sqlAdminstratorCredentials    

)


The last parameter, $sqlAdministratorCredentials, has a type of PSCredential. The other parameters are just strings.

The call that actually creates the Server is shown in Figure 2.

Figure 2

New-AzureRmSqlServer `

    -ResourceGroupName $resourceGroupName `

    -ServerName $serverName `

    -Location $location `

    -ServerVersion $serverVersion `

    -SqlAdministratorCredentials $sqlAdminstratorCredentials 


There is certainly more code in the Runbook. I am just focusing on the key areas related to this particular post.

In Figure 2, you can see that I am mapping the parameters in my param section in Figure 1 with the parameters of the New-AzureRmSqlServer Powershell cmdlet. The first parameter in Figure 1, $resourceGroupName, will be passed to the –ResourceGroupName paramter of the cmdlet. And so on.

As we all know, and sometimes even practice, Testing is important. Thus, I fully test each of my Runbooks multiple times to make sure they do what I want them to. For example, this Runbook should create a new Azure SQL Database Server. It should most definitely NOT put Max in Space. Azure Automation includes a feature in Edit mode of a Runbook called the Test Pane. It allows you to enter in parameters and run the Runbook before you publish it to make sure it works the way you want it to. Note that the Test Pane does not pretend to do things. It ACTUALLY performs the actions. So, running a Runbook that creates a server in the Test Pane will ACTUALLY create that server. Just keep that in mind.

The Parameters section of the Test Pane for my Runbook looked like Figure 3.

Figure 3

image

With that String parameters, it is easy to just type what I want in the textbox. But, for the PSCredential parameter at the bottom, I was unsure what to do. I figured, since this is just a textbox, I couldn’t just magically pass in a Credential Asset. So, I tried passing in an expression that used the Get-AzureRmAutomationCredential cmdlet that returns the Credential Asset specified. That didn’t work very well. I then started digging through documentation, figuring I would see references and examples of passing a Credential Asset in the Test Pane. It took me a bit, but I finally landed on an Azure.com blog post titled Azure Automation: Runbook Input, Output, and Nested Runbooks. While this post didn’t match all that closely with the search criteria around the Test Pane, it did contain my answer in a section on starting Runbooks:

If a runbook parameter takes a PSCredential type then you need to pass the string name of a Azure Automation credential asset.  Behind the scenes, the Azure Automation credential asset with that name will be retrieved and passed to the runbook.

It turns out, I was not giving the super smart folks on Azure Automation team enough credit. It IS as magical as just putting the name of the Credential Asset in the textbox. While that section of text from the blog post did not mention the Test Pane, the Test Pane is essentially a means of running the Runbook currently in Edit mode without having to Publish it first. So, using the Test Pane IS running the Runbook. Therefore, the above worked just fine.

I learned some valuable things here:

1. Sometimes, the simple answer you dismiss because it is too simple is ACTUALLY the answer.

2. The Azure Automation team is very smart. I knew this one already. But this was a great reminder.

3. My kids have never seen Space Camp.


Out With It, Man!

Just put the name of the Credential Asset into the textbox for the Credential parameter in the Test Pane. For example, if your Credential Asset is named MyCredentialAsset, then the Test Pane could look like Figure 4.

Figure 4

image

Yeah. That’s really it.

Connect Suggestion: SSAS Tabular Images In Azure VM Gallery

Greetings, noble readers.

Currently, when utilizing the SQL Server images in the VM Gallery in Azure, any installations of SQL Server Analysis Services default to Multidimensional. Thus, if you want SSAS Tabular, you have additional work to perform.

I was just chatting with a Senior Program Manager on the SQL Server Analysis Services product team. They currently don’t have anything in their plans for providing SQL Server Gallery Images with SSAS Tabular instead of Multidimensional. We agreed that it is a good idea for that to happen. We also agreed that a Connect suggestion would be a great way to gauge broader community support/appetite for providing Gallery images with Tabular installed.

<insert fanfare and trumpets and stuff>

Below is the link to the suggestion I made on Connect.Microsoft.com. If you agree that having SQL Server Images in the Azure VM Gallery with SSAS Tabular already installed would be a good thing, please vote up the suggestion as it will help the Product Team to justify the effort it would take to do so. If you don’t have strong feelings either way, please vote it up for those of us that do. Smile

Provide SQL Server Image in Azure VM Gallery With SSAS Tabular Installed

Your participation in this endeavor is much appreciated.

Thank you for your support.

Anyone Can SQL

I love the SQL Community. Plain and simple. I will extend that to the overall Microsoft Data community as well. We are a hugely supportive bunch. That fact that many of us refer to it as #SQLFamily is not an accident. There are so many ways to reach out for and provide help. A huge number of folks in this community blog and present and offer help on Twitter, StackOverflow, MSDN, etc. It is truly astounding to me the depth of help you can get from this community.

I get a lot of joy out of seeing people welcomed into the SQL Community. You want to learn SQL? Come join us. We’ll help. I love encouraging people to get involved. I often tell folks just starting out about how welcoming and supportive this community is. Sometimes they get involved and encourage others to do the same. Typically, it works out wonderfully for everyone.

Courtesy of ktylerconk on FlickrHowever, recently, I was told of a pretty terrible experience that happened at a SQL-related event. People with certain backgrounds were treated with derision and scorn. They were laughed at. They were told they would not be taken seriously in this community because of their extensive experience with database technologies other than SQL Server. This is the exact opposite of what this community stands for.

In Pixar’s Ratatouille, August Gusteau is a famous chef. He writes books, does interviews, etc. One thing he is famous for is his closely held belief that “Anyone can cook.” A key antagonist, and infamous food critic, Anton Ego, doesn’t agree with Gusteau.

Note: There will be some spoilers for the movie coming shortly. If you haven’t seen it, fix it. It is another fine example of Pixar’s spectacular ability to craft stories and characters that resonate. It’s charming.

Anton Ego prides himself on his ability to eviscerate chefs and restaurants with his scathing reviews. He raises himself up by tearing others down. In this sense, the name of the character is spot on.

It isn’t until near the end of the film, when he enjoys an amazing meal that takes him back to his childhood, a dish prepared by a chef who is a rat, that he comes to understand what Gusteau was talking about.

In his review, Ego writes, “The world is often unkind to new talent, new creations. The new needs friends. Last night, I experienced something new, an extra-ordinary meal from a singularly unexpected source. To say that both the meal and its maker have challenged my preconceptions about fine cooking is a gross understatement. They have rocked me to my core. In the past, I have made no secret of my disdain for Chef Gusteau’s famous motto: ‘Anyone can cook.’ But I realize, only now do I truly understand what he meant. Not everyone can become a great artist, but a great artist can come from anywhere. It is difficult to imagine more humble origins than those of the genius now cooking at Gusteau’s, who is, in this critic’s opinion, nothing less than the finest chef in France.”

My goal with this post is not to rant or to point fingers or to vent my or anyone else’s anger or disappointment over this situation. Rather, it is to remind all of us that EVERYONE is born knowing NOTHING about databases in general and SQL Server in particular. We all come from somewhere. I started with Access. I know many people who did. Some people started with FoxPro. Others with Sybase. Others with DB2, or Oracle, or FileMaker. The list goes on and on. The fact that we have such varying experiences helps to make the community rich and varied. Like Ego came to learn, we will not raise ourselves up by tearing others down.

The onus is upon us, in my opinion, to ensure that we can live up to the promise of this outstanding community and treat people who want to learn with respect and encouragement. The onus is upon us to apply Gusteau’s most cherished belief to our community as well: Anyone can SQL.